Experian ESG Presentation Deck
Executive Summary
Improving Financial Health
Data
Social - Improving Financial Health
Consumer profiles
Number of people with profiles in Experian's consumer bureaus
Employees
Free access to credit scores
North America
Latin America
UK & Ireland
Total number of people using Experian to access their credit scores for free
Limpa Nome
Value of debts on Limpa Nome for which consumers took up renegotiated offer
Value of payments made to pay off renegotiated debts
Value of debt written off for consumers
Social Innovation impact
Revenue generated through social innovation products
Total revenue generated through social innovation products since 2013 (cumulative)
People reached through social innovation products
Total people reached through social innovation products since 2013 (cumulative)
Supply Chain
Unit
billions of people
United for Financial Health
People reached through United for Financial Health programme (cumulative)
83 O Experian Public
Unit
Millions of people
Millions of people
Millions of people
Millions of people
Unit
$bn
$bn
$bn
Unit
$m
$m
Millions of people
Millions of people
Environment
2022
1.41
2022
52
71
11
134
2022
5.9
1.2
4.7
9.0
2022
59
162
21
82
Unit
Millions of people
https://www.experianlc.com/responsibility/data-and-assurance/
2022
87
2021
1.28
2021
41
59
9.5
110
2021
7.8
1.1
6.7
8.3
2021
64
103
28
61
2020
1.20
2021
35
2020
29.5
45
7.5
82
Governance
2020
22
40
14
35
2019
1.00
2019
19
32
5.6
57
2019
0.5
Policies & Data tables
2020
2.7
0.4
0.1
2.3
0.4
Number of people helped by Limpa Nome
Millions of people
2.9
0.6
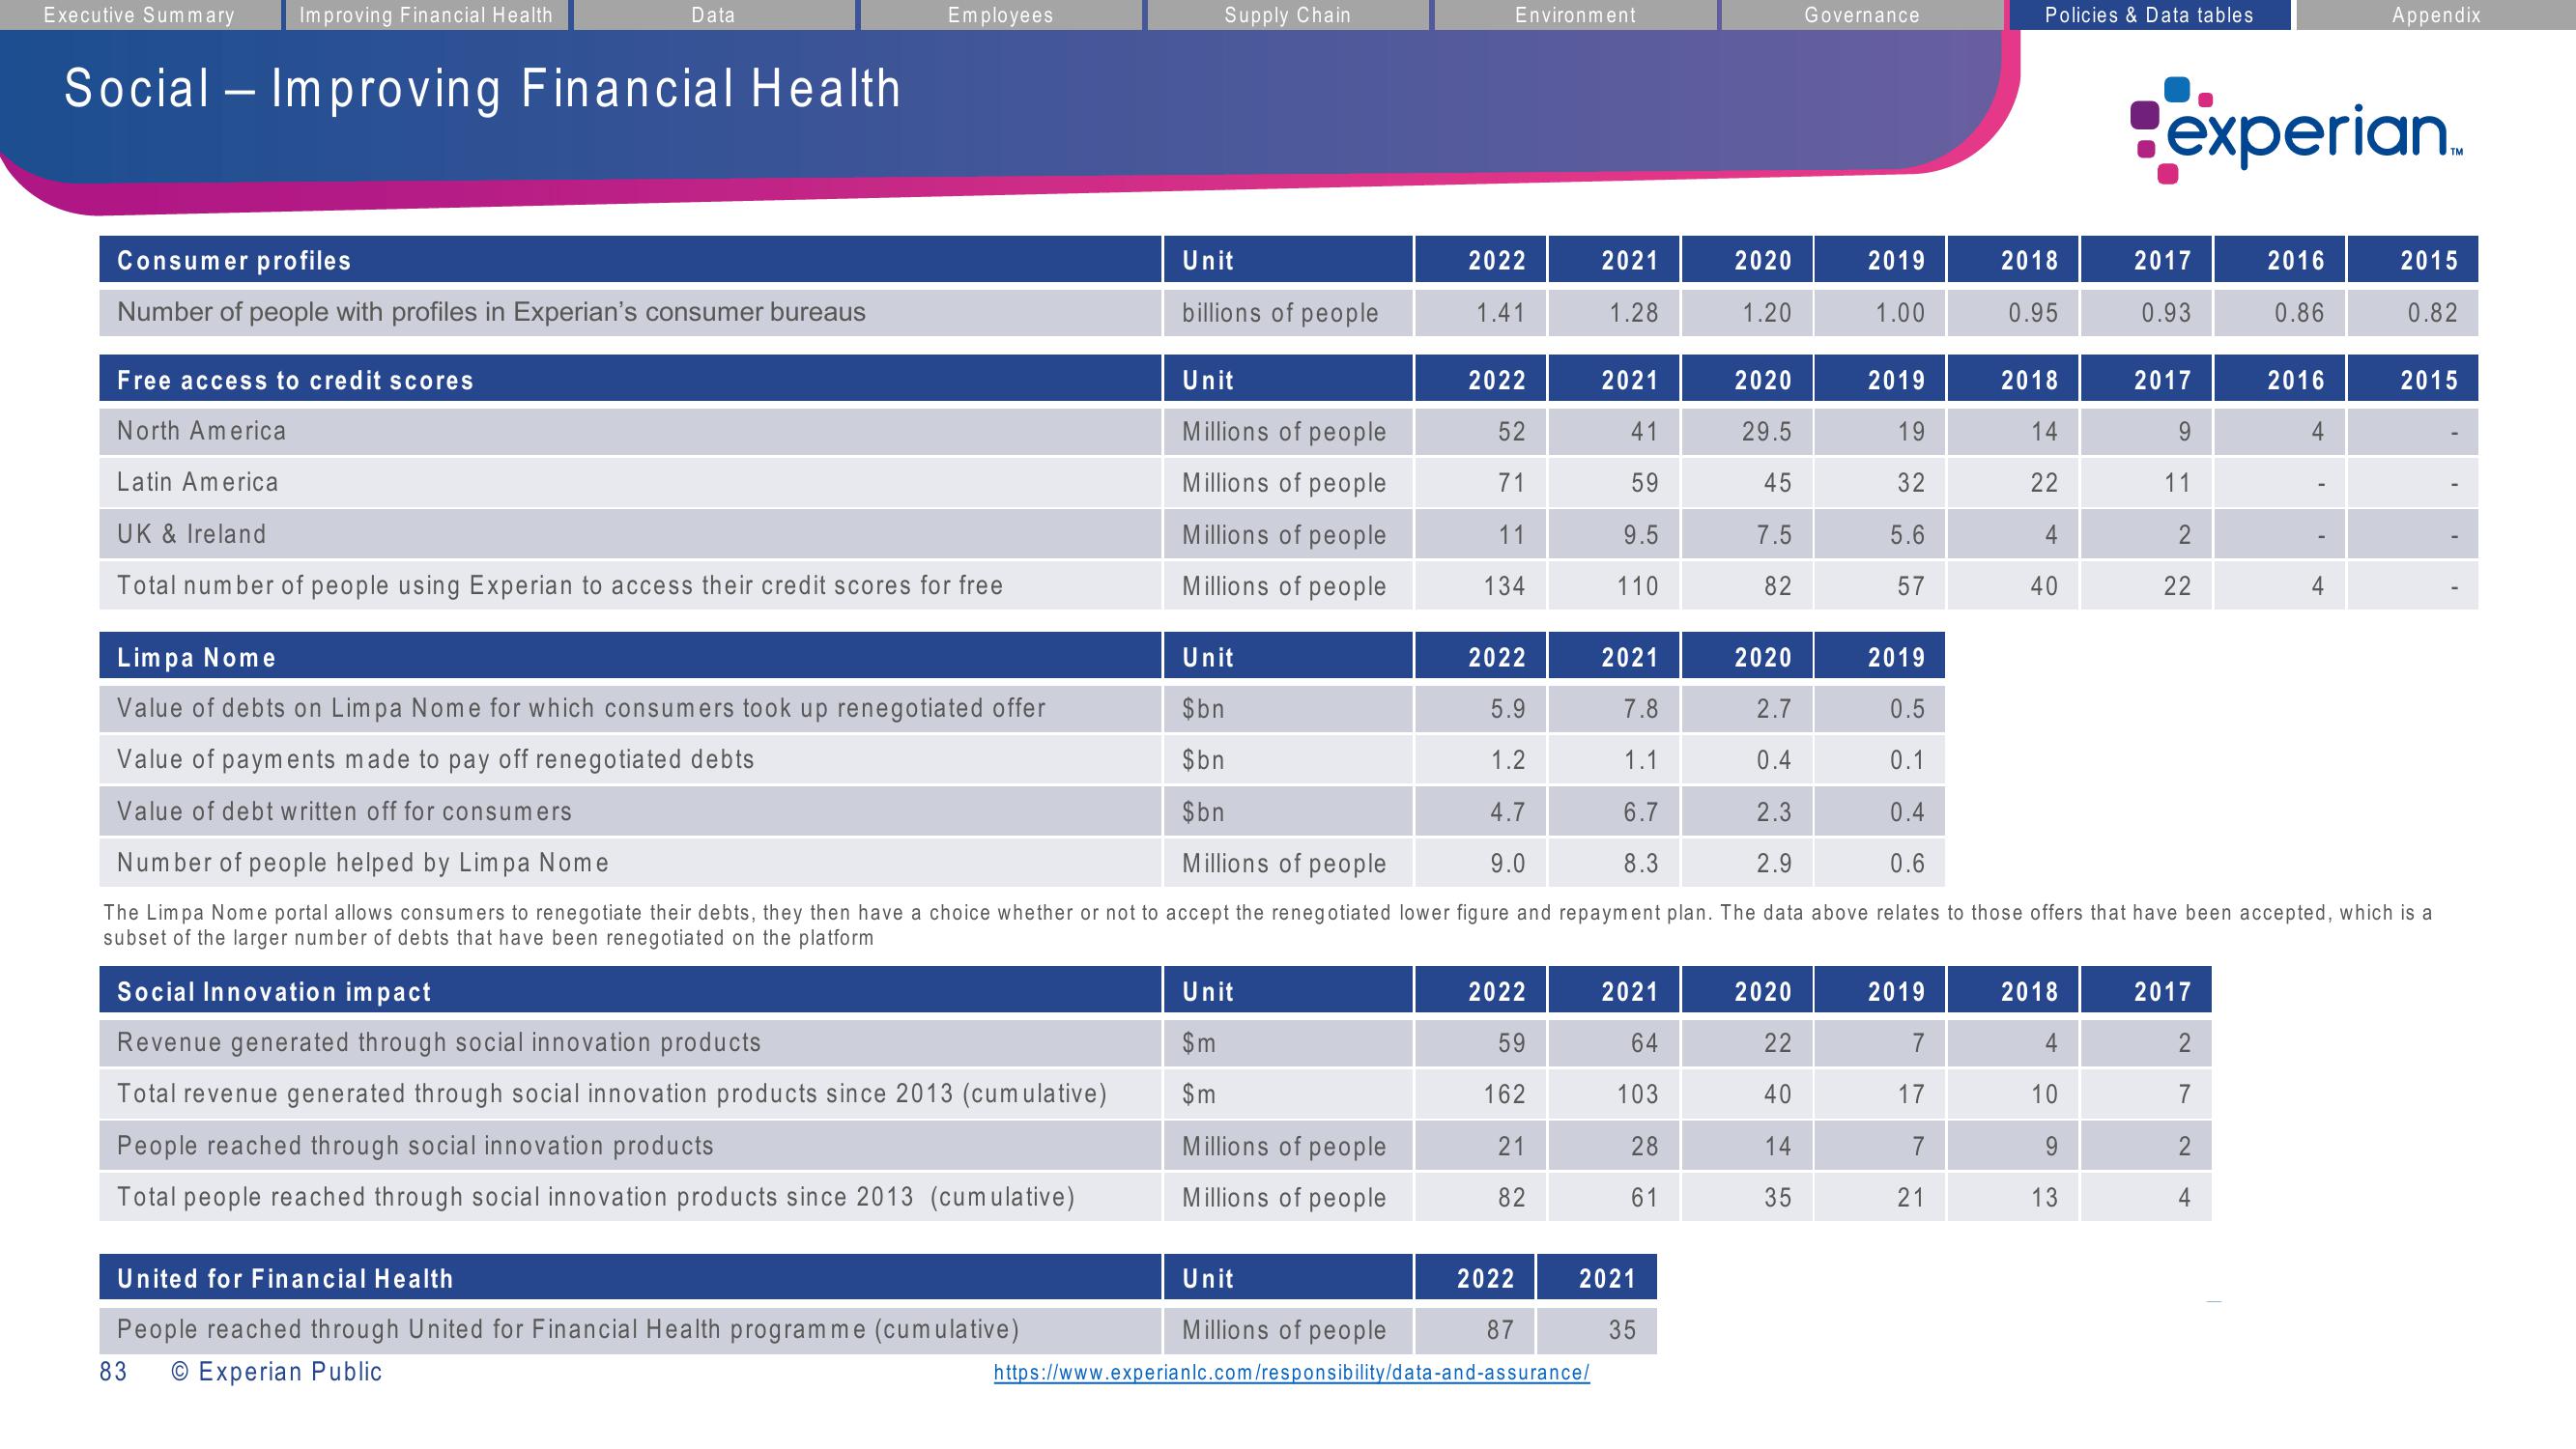
The Limpa Nome portal allows consumers to renegotiate their debts, they then have a choice whether or not to accept the renegotiated lower figure and repayment plan. The data above relates to those offers that have been accepted, which is a
subset of the larger number of debts that have been renegotiated on the platform
2019
7
17
7
21
2018
0.95
2018
14
22
4
40
2018
4
10
9
13
experian
2017
0.93
2017
11
2
22
2017
2016
0.86
7
2
4
2016
4
I
Appendix
4
TM
2015
0.82
2015View entire presentation