Trian Partners Activist Presentation Deck
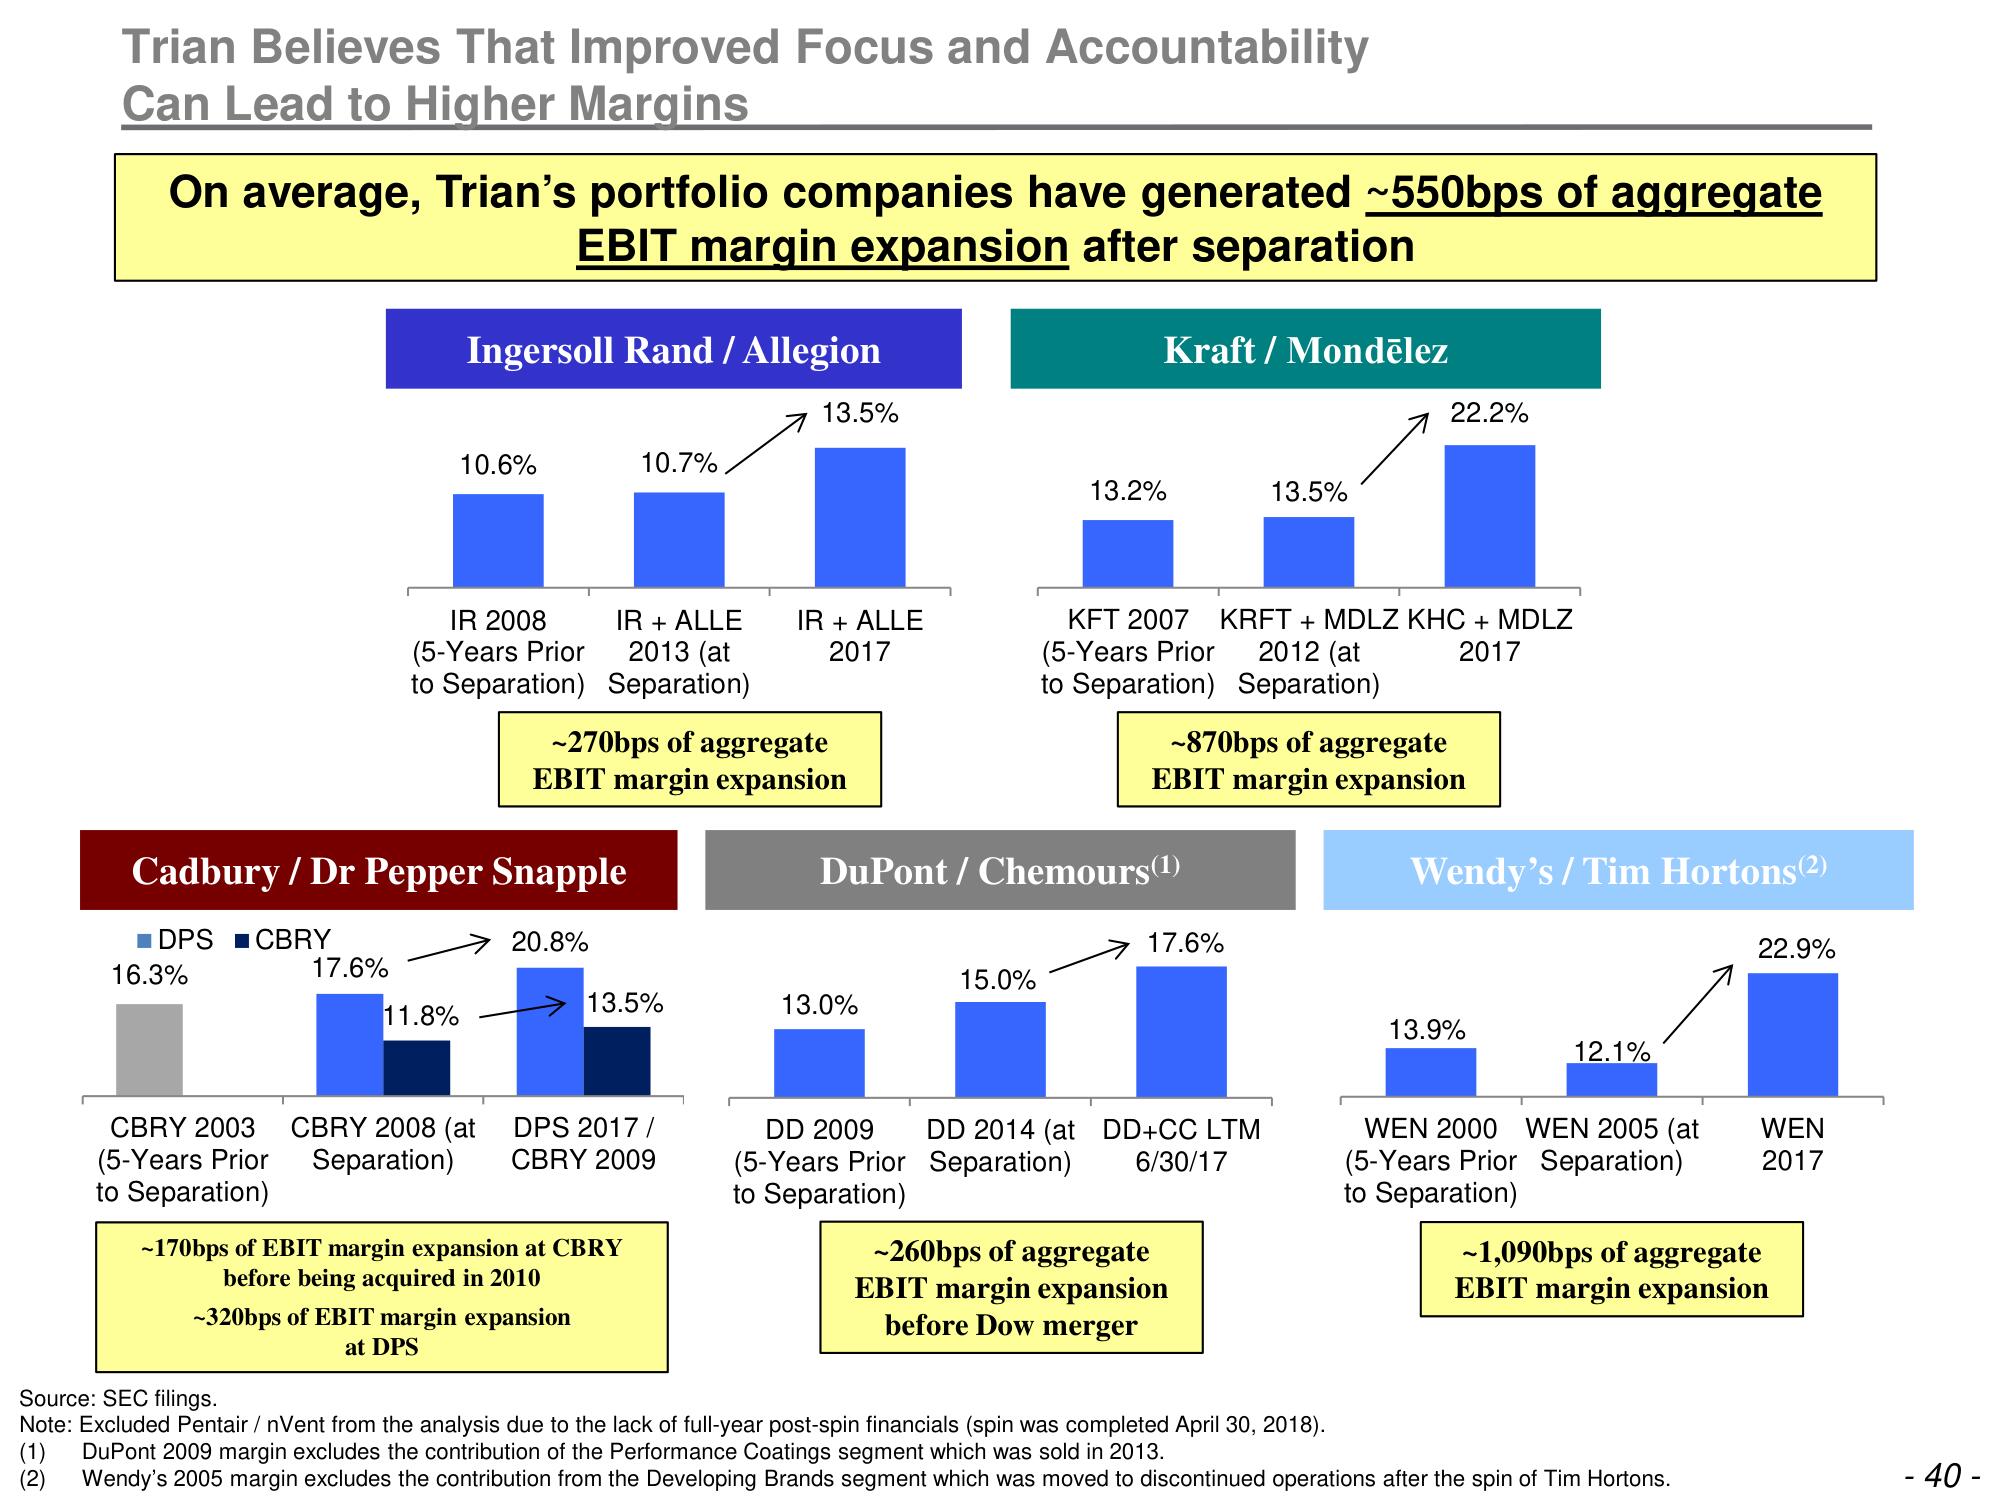
Trian Believes That Improved Focus and Accountability
Can Lead to Higher Margins
On average, Trian's portfolio companies have generated ~550bps of aggregate
EBIT margin expansion after separation
CBRY 2003
(5-Years Prior
to Separation)
17.6%
Ingersoll Rand / Allegion
10.6%
IR 2008
(5-Years Prior
to Separation)
11.8%
Cadbury / Dr Pepper Snapple
20.8%
■ DPS CBRY
16.3%
IR + ALLE
2013 (at
Separation)
0.7%
-270bps of aggregate
EBIT margin expansion
-320bps of EBIT margin expansion
at DPS
13.5%
CBRY 2008 (at DPS 2017/
Separation) CBRY 2009
-170bps of EBIT margin expansion at CBRY
before being acquired in 2010
13.5%
IR + ALLE
2017
13.0%
Kraft / Mondēlez
15.0%
13.2%
DuPont / Chemours (1)
KFT 2007 KRFT + MDLZ KHC + MDLZ
(5-Years Prior 2012 (at
2017
to Separation) Separation)
-870bps of aggregate
EBIT margin expansion
17.6%
13.5%
DD 2009 DD 2014 (at DD+CC LTM
(5-Years Prior Separation) 6/30/17
to Separation)
22.2%
-260bps of aggregate
EBIT margin expansion
before Dow merger
Wendy's / Tim Hortons (2)
13.9%
12.1%
WEN 2000 WEN 2005 (at
(5-Years Prior Separation)
to Separation)
22.9%
Source: SEC filings.
Note: Excluded Pentair /nVent from the analysis due to the lack of full-year post-spin financials (spin was completed April 30, 2018).
(1) DuPont 2009 margin excludes the contribution of the Performance Coatings segment which was sold in 2013.
(2) Wendy's 2005 margin excludes the contribution from the Developing Brands segment which was moved to discontinued operations after the spin of Tim Hortons.
WEN
2017
~1,090bps of aggregate
EBIT margin expansion
- 40 -View entire presentation