J.P.Morgan Results Presentation Deck
JPMORGAN CHASE & CO.
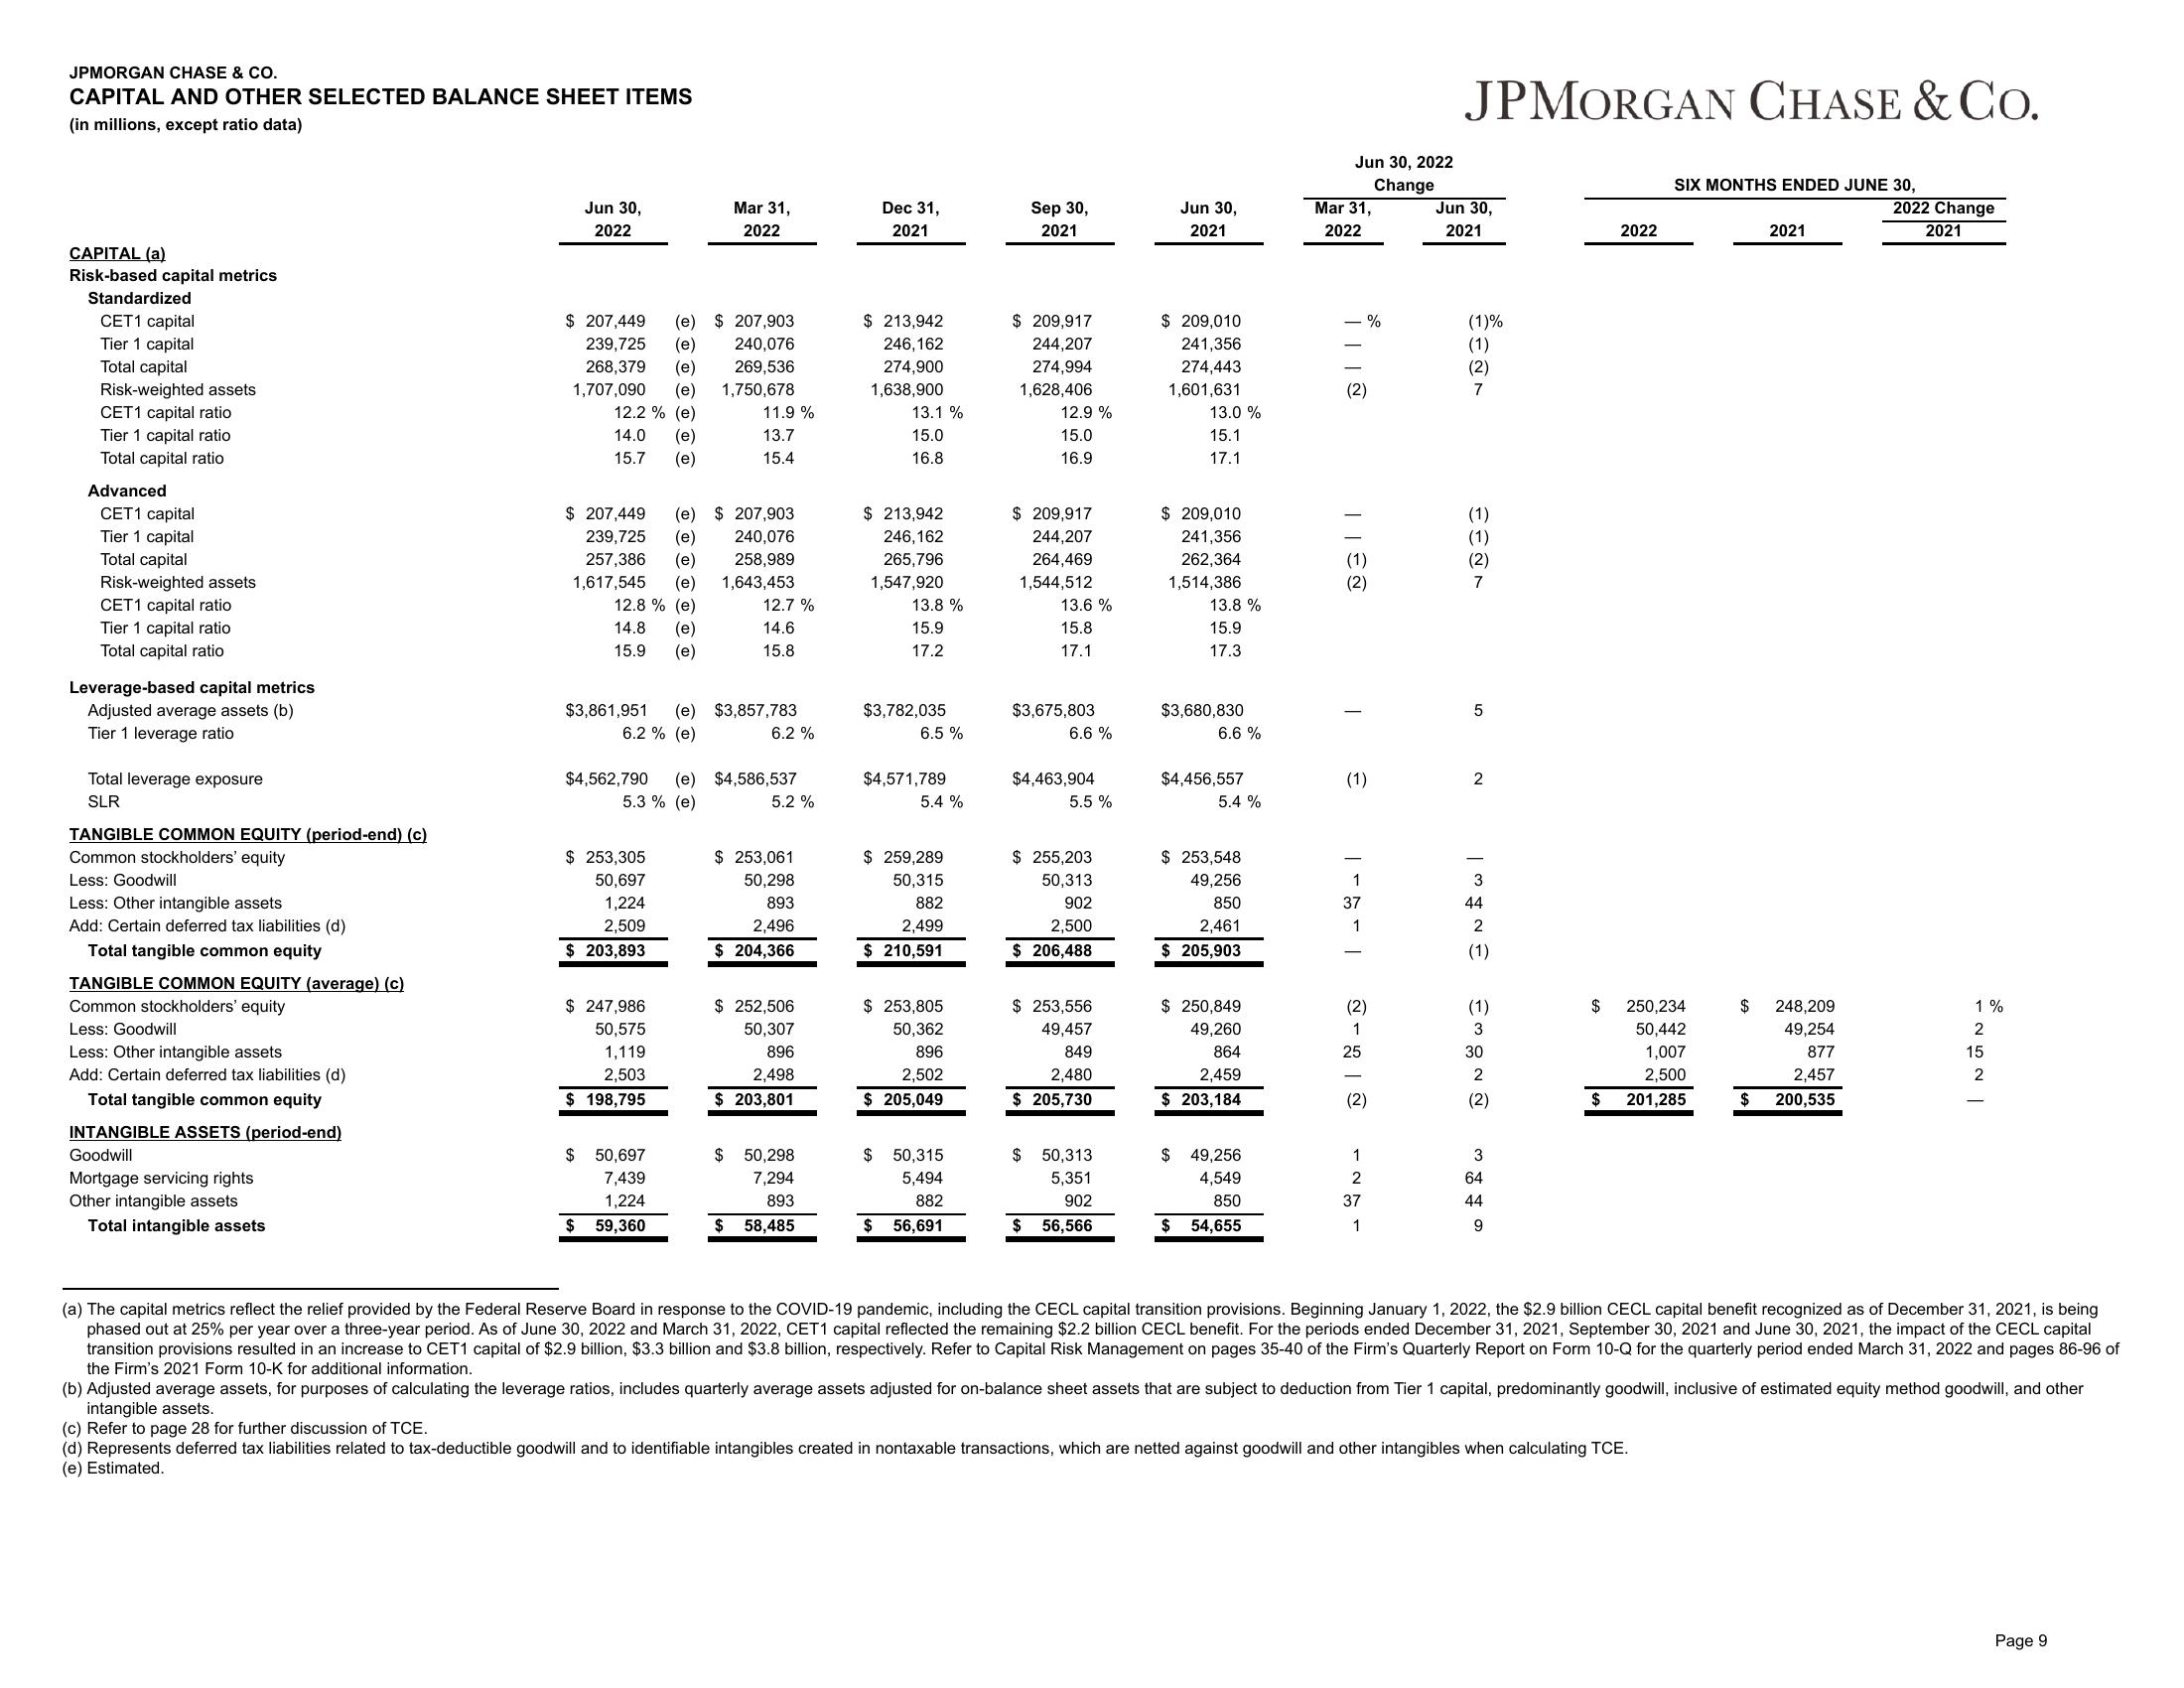
CAPITAL AND OTHER SELECTED BALANCE SHEET ITEMS
(in millions, except ratio data)
CAPITAL (a)
Risk-based capital metrics
Standardized
CET1 capital
Tier 1 capital
Total capital
Risk-weighted assets
CET1 capital ratio
Tier 1 capital ratio
Total capital ratio
Advanced
CET1 capital
Tier 1 capital
Total capital
Risk-weighted assets
CET1 capital ratio
Tier 1 capital ratio
Total capital ratio
Leverage-based capital metrics
Adjusted average assets (b)
Tier 1 leverage ratio
Total leverage exposure
SLR
TANGIBLE COMMON EQUITY (period-end) (c)
Common stockholders' equity
Less: Goodwill
Less: Other intangible assets
Add: Certain deferred tax liabilities (d)
Total tangible common equity
TANGIBLE COMMON EQUITY (average) (c)
Common stockholders' equity
Less: Goodwill
Less: Other intangible assets
Add: Certain deferred tax liabilities (d)
Total tangible common equity
INTANGIBLE ASSETS (period-end)
Goodwill
Mortgage servicing rights
Other intangible assets
Total intangible assets
Jun 30,
2022
$ 207,449 (e) $207,903
239,725 (e)
240,076
269,536
268,379 (e)
1,707,090 (e) 1,750,678
12.2% (e)
14.0 (e)
15.7 (e)
$ 207,449 (e) $207,903
239,725 (e) 240,076
257,386 (e) 258,989
1,617,545 (e) 1,643,453
12.8 % (e)
14.8 (e)
15.9 (e)
Mar 31,
2022
$ 253,305
50,697
1,224
2,509
$ 203,893
$3,861,951 (e) $3,857,783
6.2 % (e)
6.2 %
$247,986
50,575
1,119
2,503
$ 198,795
$
11.9%
13.7
15.4
$4,562,790 (e) $4,586,537
5.3% (e)
50,697
7,439
1,224
$ 59,360
12.7 %
14.6
15.8
5.2 %
$ 253,061
50,298
893
2,496
$ 204,366
$ 252,506
50,307
896
2,498
$ 203,801
$ 50,298
7,294
893
$ 58,485
Dec 31,
2021
$ 213,942
246,162
274,900
1,638,900
13.1 %
15.0
16.8
$ 213,942
246,162
265,796
1,547,920
13.8 %
15.9
17.2
$3,782,035
6.5%
$4,571,789
5.4 %
$ 259,289
50,315
882
2,499
$ 210,591
$ 253,805
50,362
896
2,502
$ 205,049
$ 50,315
5,494
882
$ 56,691
Sep 30,
2021
$209,917
244,207
274,994
1,628,406
12.9 %
15.0
16.9
$ 209,917
244,207
264,469
1,544,512
13.6 %
15.8
17.1
$3,675,803
6.6%
$4,463,904
5.5 %
$ 255,203
50,313
902
2,500
$206,488
$ 253,556
49,457
849
2,480
$ 205,730
$ 50,313
5,351
902
$ 56,566
Jun 30,
2021
$ 209,010
241,356
274,443
1,601,631
13.0 %
15.1
17.1
$209,010
241,356
262,364
1,514,386
13.8%
15.9
17.3
$3,680,830
6.6 %
$4,456,557
5.4 %
$ 253,548
49,256
850
2,461
$ 205,903
$ 250,849
49,260
864
2,459
$203,184
$ 49,256
4,549
850
$ 54,655
Jun 30, 2022
Change
Mar 31,
2022
| ||
(2)
1130
I
%
(1)
1
37
1
(2)
1
25
(2)
1
2
37
1
JPMORGAN CHASE & CO.
Jun 30,
2021
(1)%
(1)
(2)
7
(1)
(1)
(2)
7
5
2
N NO WÊ EN #w/
44
(1)
30
3
64
44
9
2022
$
SIX MONTHS ENDED JUNE 30,
$ 250,234
50,442
1,007
2,500
201,285
2021
$ 248,209
49,254
877
2,457
$ 200,535
2022 Change
2021
INGNO
(a) The capital metrics reflect the relief provided by the Federal Reserve Board in response to the COVID-19 pandemic, including the CECL capital transition provisions. Beginning January 1, 2022, the $2.9 billion CECL capital benefit recognized as of December 31, 2021, is being
phased out at 25% per year over a three-year period. As of June 30, 2022 and March 31, 2022, CET1 capital reflected the remaining $2.2 billion CECL benefit. For the periods ended December 31, 2021, September 30, 2021 and June 30, 2021, the impact of the CECL capital
transition provisions resulted in an increase to CET1 capital of $2.9 billion, $3.3 billion and $3.8 billion, respectively. Refer to Capital Risk Management on pages 35-40 of the Firm's Quarterly Report on Form 10-Q for the quarterly period ended March 31, 2022 and pages 86-96 of
the Firm's 2021 Form 10-K for additional information.
(b) Adjusted average assets, for purposes of calculating the leverage ratios, includes quarterly average assets adjusted for on-balance sheet assets that are subject to deduction from Tier 1 capital, predominantly goodwill, inclusive of estimated equity method goodwill, and other
intangible assets.
(c) Refer to page 28 for further discussion of TCE.
(d) Represents deferred tax liabilities related to tax-deductible goodwill and to identifiable intangibles created in nontaxable transactions, which are netted against goodwill and other intangibles when calculating TCE.
(e) Estimated.
Page 9View entire presentation