Morgan Stanley Investor Presentation Deck
Morgan Stanley
End Notes
These notes refer to the financial metrics and/or defined term presented on Slide 3
1. 2014 Adjusted Operating Performance Metrics:
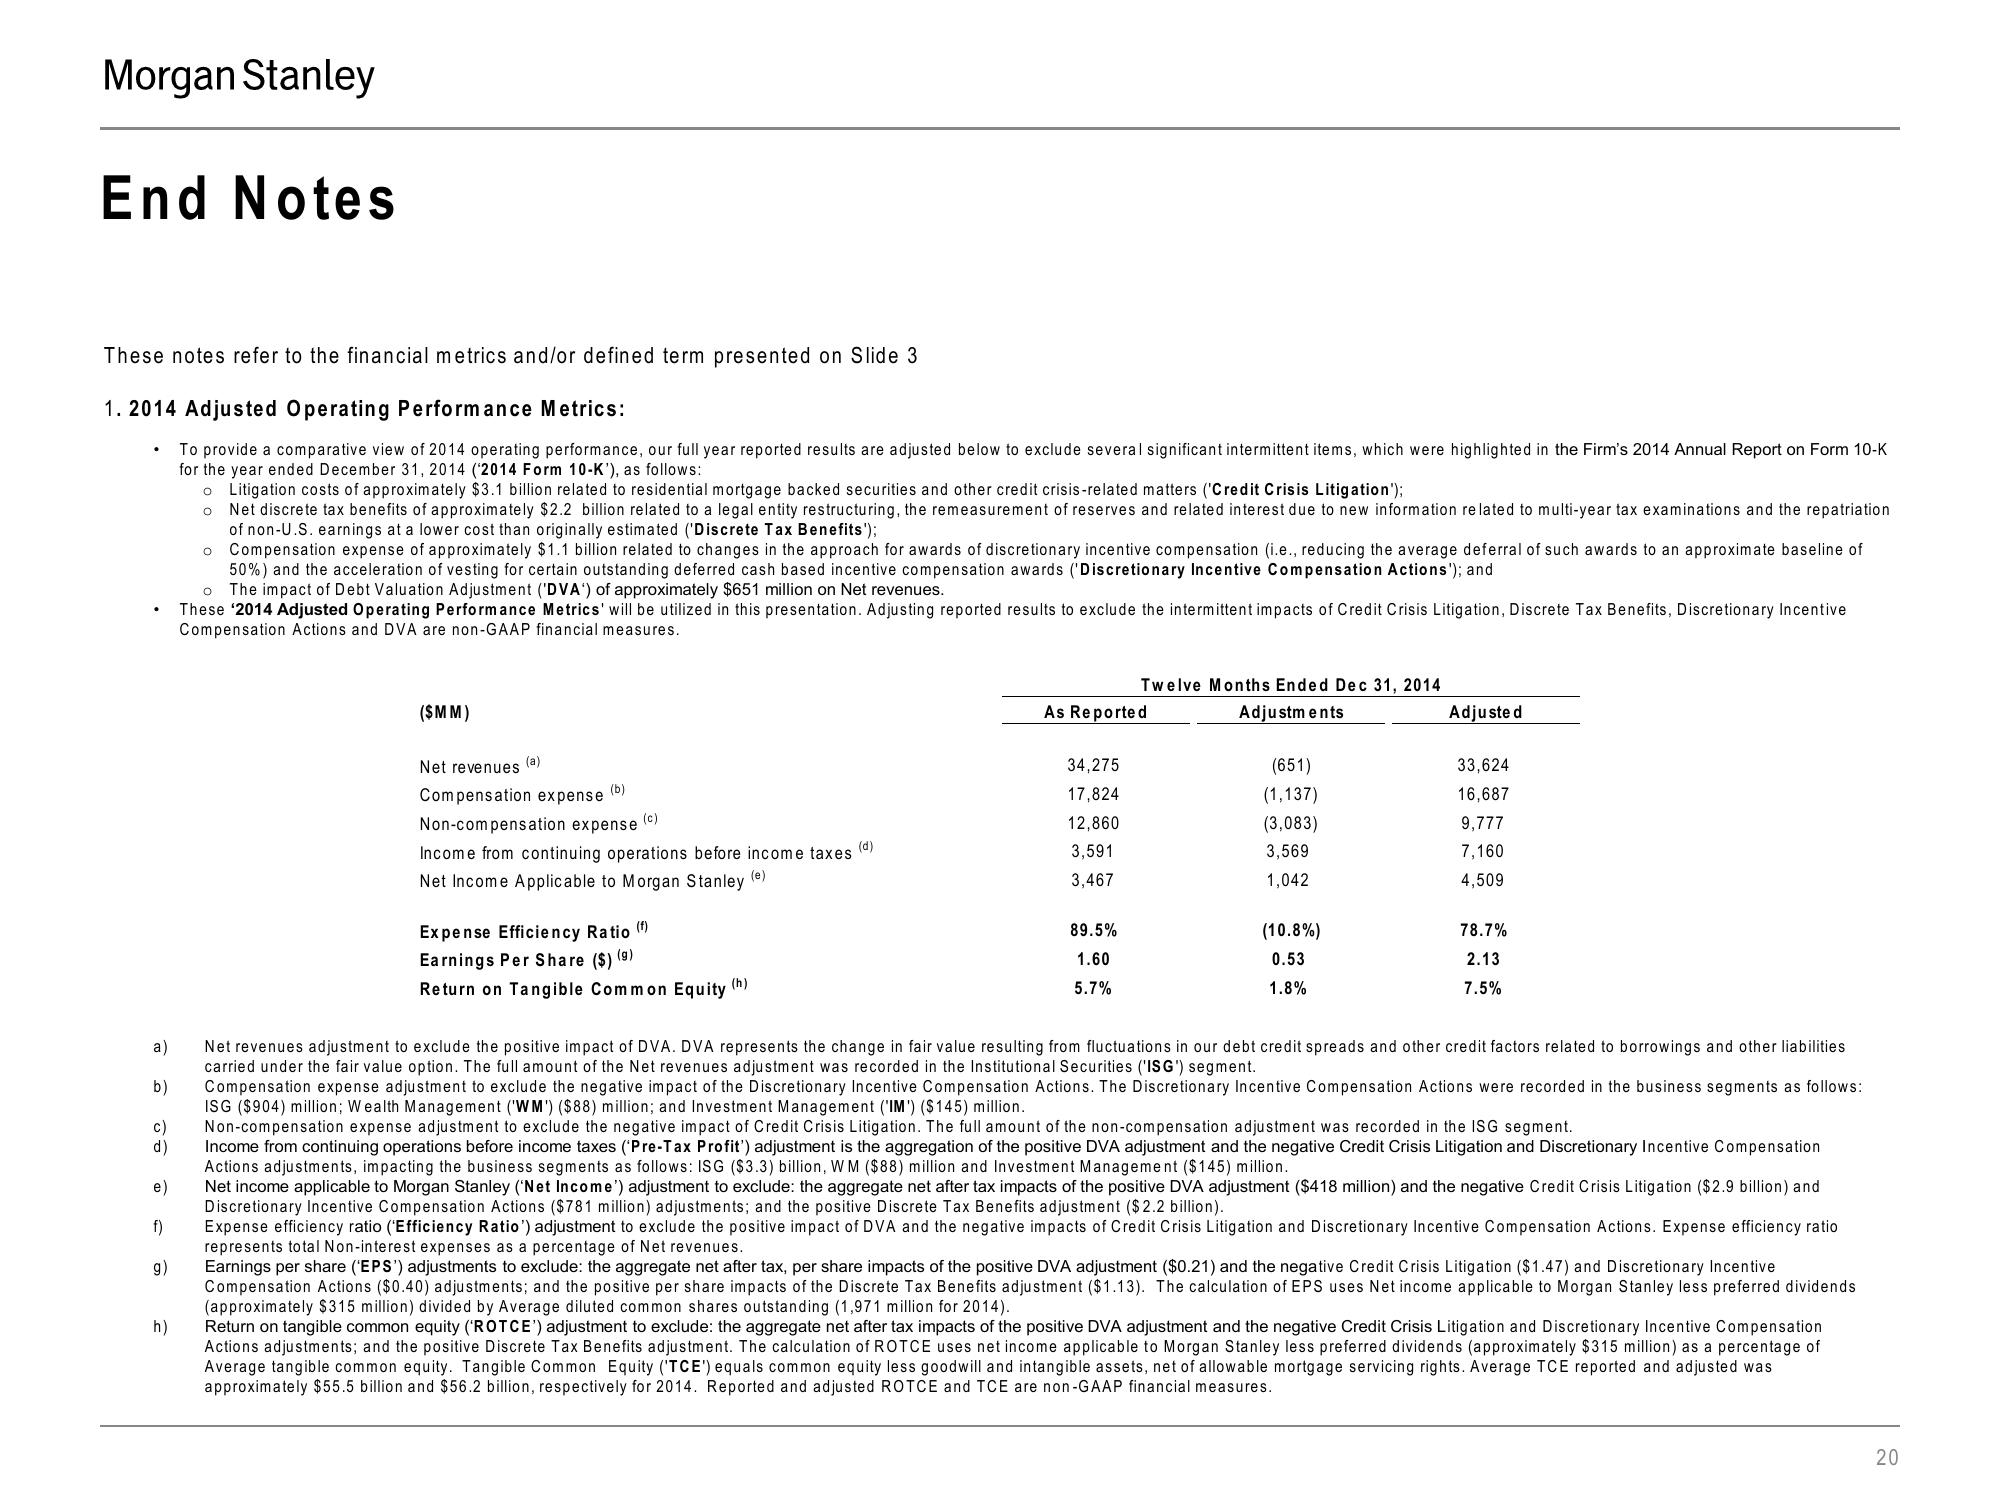
To provide a comparative view of 2014 operating performance, our full year reported results are adjusted below to exclude several significant intermittent items, which were highlighted in the Firm's 2014 Annual Report on Form 10-K
for the year ended December 31, 2014 (2014 Form 10-K'), as follows:
o Litigation costs of approximately $3.1 billion related to residential mortgage backed securities and other credit crisis-related matters ('Credit Crisis Litigation');
.
a)
b)
c)
d)
e)
f)
g)
h)
Net discrete tax benefits of approximately $2.2 billion related to a legal entity restructuring, the remeasurement of reserves and related interest due to new information related to multi-year tax examinations and the repatriation
of non-U.S. earnings at a lower cost than originally estimated ('Discrete Tax Benefits');
o
Compensation expense of approximately $1.1 billion related to changes in the approach for awards of discretionary incentive compensation (i.e., reducing the average deferral of such awards to an approximate baseline of
50%) and the acceleration of vesting for certain outstanding deferred cash based incentive compensation awards ('Discretionary Incentive Compensation Actions'); and
o
The impact of Debt Valuation Adjustment ('DVA') of approximately $651 million on Net revenues.
These '2014 Adjusted Operating Performance Metrics' will be utilized in this presentation. Adjusting reported results to exclude the intermittent impacts of Credit Crisis Litigation, Discrete Tax Benefits, Discretionary Incentive
Compensation Actions and DVA are non-GAAP financial measures.
($MM)
Net revenues (a)
Compensation expense (b)
(c)
Non-compensation expense
Income from continuing operations before income taxes
(d)
Net Income Applicable to Morgan Stanley (e)
Expense Efficiency Ratio (f)
Earnings Per Share ($) (9)
Return on Tangible Common Equity (h)
As Reported
34,275
17,824
12,860
3,591
3,467
Twelve Months Ended Dec 31, 2014
Adjustments
89.5%
1.60
5.7%
(651)
(1,137)
(3,083)
3,569
1,042
(10.8%)
0.53
1.8%
Adjusted
33,624
16,687
9,777
7,160
4,509
78.7%
2.13
7.5%
Net revenues adjustment to exclude the positive impact of DVA. DVA represents the change in fair value resulting from fluctuations in our debt credit spreads and other credit factors related to borrowings and other liabilities
carried under the fair value option. The full amount of the Net revenues adjustment was recorded in the Institutional Securities (ISG') segment.
Compensation expense adjustment to exclude the negative impact of the Discretionary Incentive Compensation Actions. The Discretionary Incentive Compensation Actions were recorded in the business segments as follows:
ISG ($904) million; Wealth Management ('WM') ($88) million; and Investment Management ('IM') ($145) million.
Non-compensation expense adjustment to exclude the negative impact of Credit Crisis Litigation. The full amount of the non-compensation adjustment was recorded in the ISG segment.
Income from continuing operations before income taxes (Pre-Tax Profit') adjustment is the aggregation of the positive DVA adjustment and the negative Credit Crisis Litigation and Discretionary Incentive Compensation
Actions adjustments, impacting the business segments as follows: ISG ($3.3) billion, WM ($88) million and Investment Management ($145) million.
Net income applicable to Morgan Stanley ('Net Income') adjustment to exclude: the aggregate net after tax impacts of the positive DVA adjustment ($418 million) and the negative Credit Crisis Litigation ($2.9 billion) and
Discretionary Incentive Compensation Actions ($781 million) adjustments; and the positive Discrete Tax Benefits adjustment ($2.2 billion).
Expense efficiency ratio ('Efficiency Ratio') adjustment to exclude the positive impact of DVA and the negative impacts of Credit Crisis Litigation and Discretionary Incentive Compensation Actions. Expense efficiency ratio
represents total Non-interest expenses as a percentage of Net revenues.
Earnings per share (EPS') adjustments to exclude: the aggregate net after tax, per share impacts of the positive DVA adjustment ($0.21) and the negative Credit Crisis Litigation ($1.47) and Discretionary Incentive
Compensation tions ($0.40) adjustments; and positive per share impacts. the Discrete Tax Benefits adjustment ($1.13). The calcul of EPS uses Ne
applicable to Morgan Stanley preferred dividends
(approximately $315 million) divided by Average diluted common shares outstanding (1,971 million for 2014).
Return on tangible common equity (ROTCE') adjustment to exclude: the aggregate net after tax impacts of the positive DVA adjustment and the negative Credit Crisis Litigation and Discretionary Incentive Compensation
Actions adjustments; and the positive Discrete Tax Benefits adjustment. The calculation of ROTCE uses net income applicable to Morgan Stanley less preferred dividends (approximately $315 million) as a percentage of
Average tangible common equity. Tangible Common Equity (TCE') equals common equity less goodwill and intangible assets, net of allowable mortgage servicing rights. Average TCE reported and adjusted was
approximately $55.5 billion and $56.2 billion, respectively for 2014. Reported and adjusted ROTCE and TCE are non-GAAP financial measures.
20View entire presentation