IBEX IPO Presentation Deck
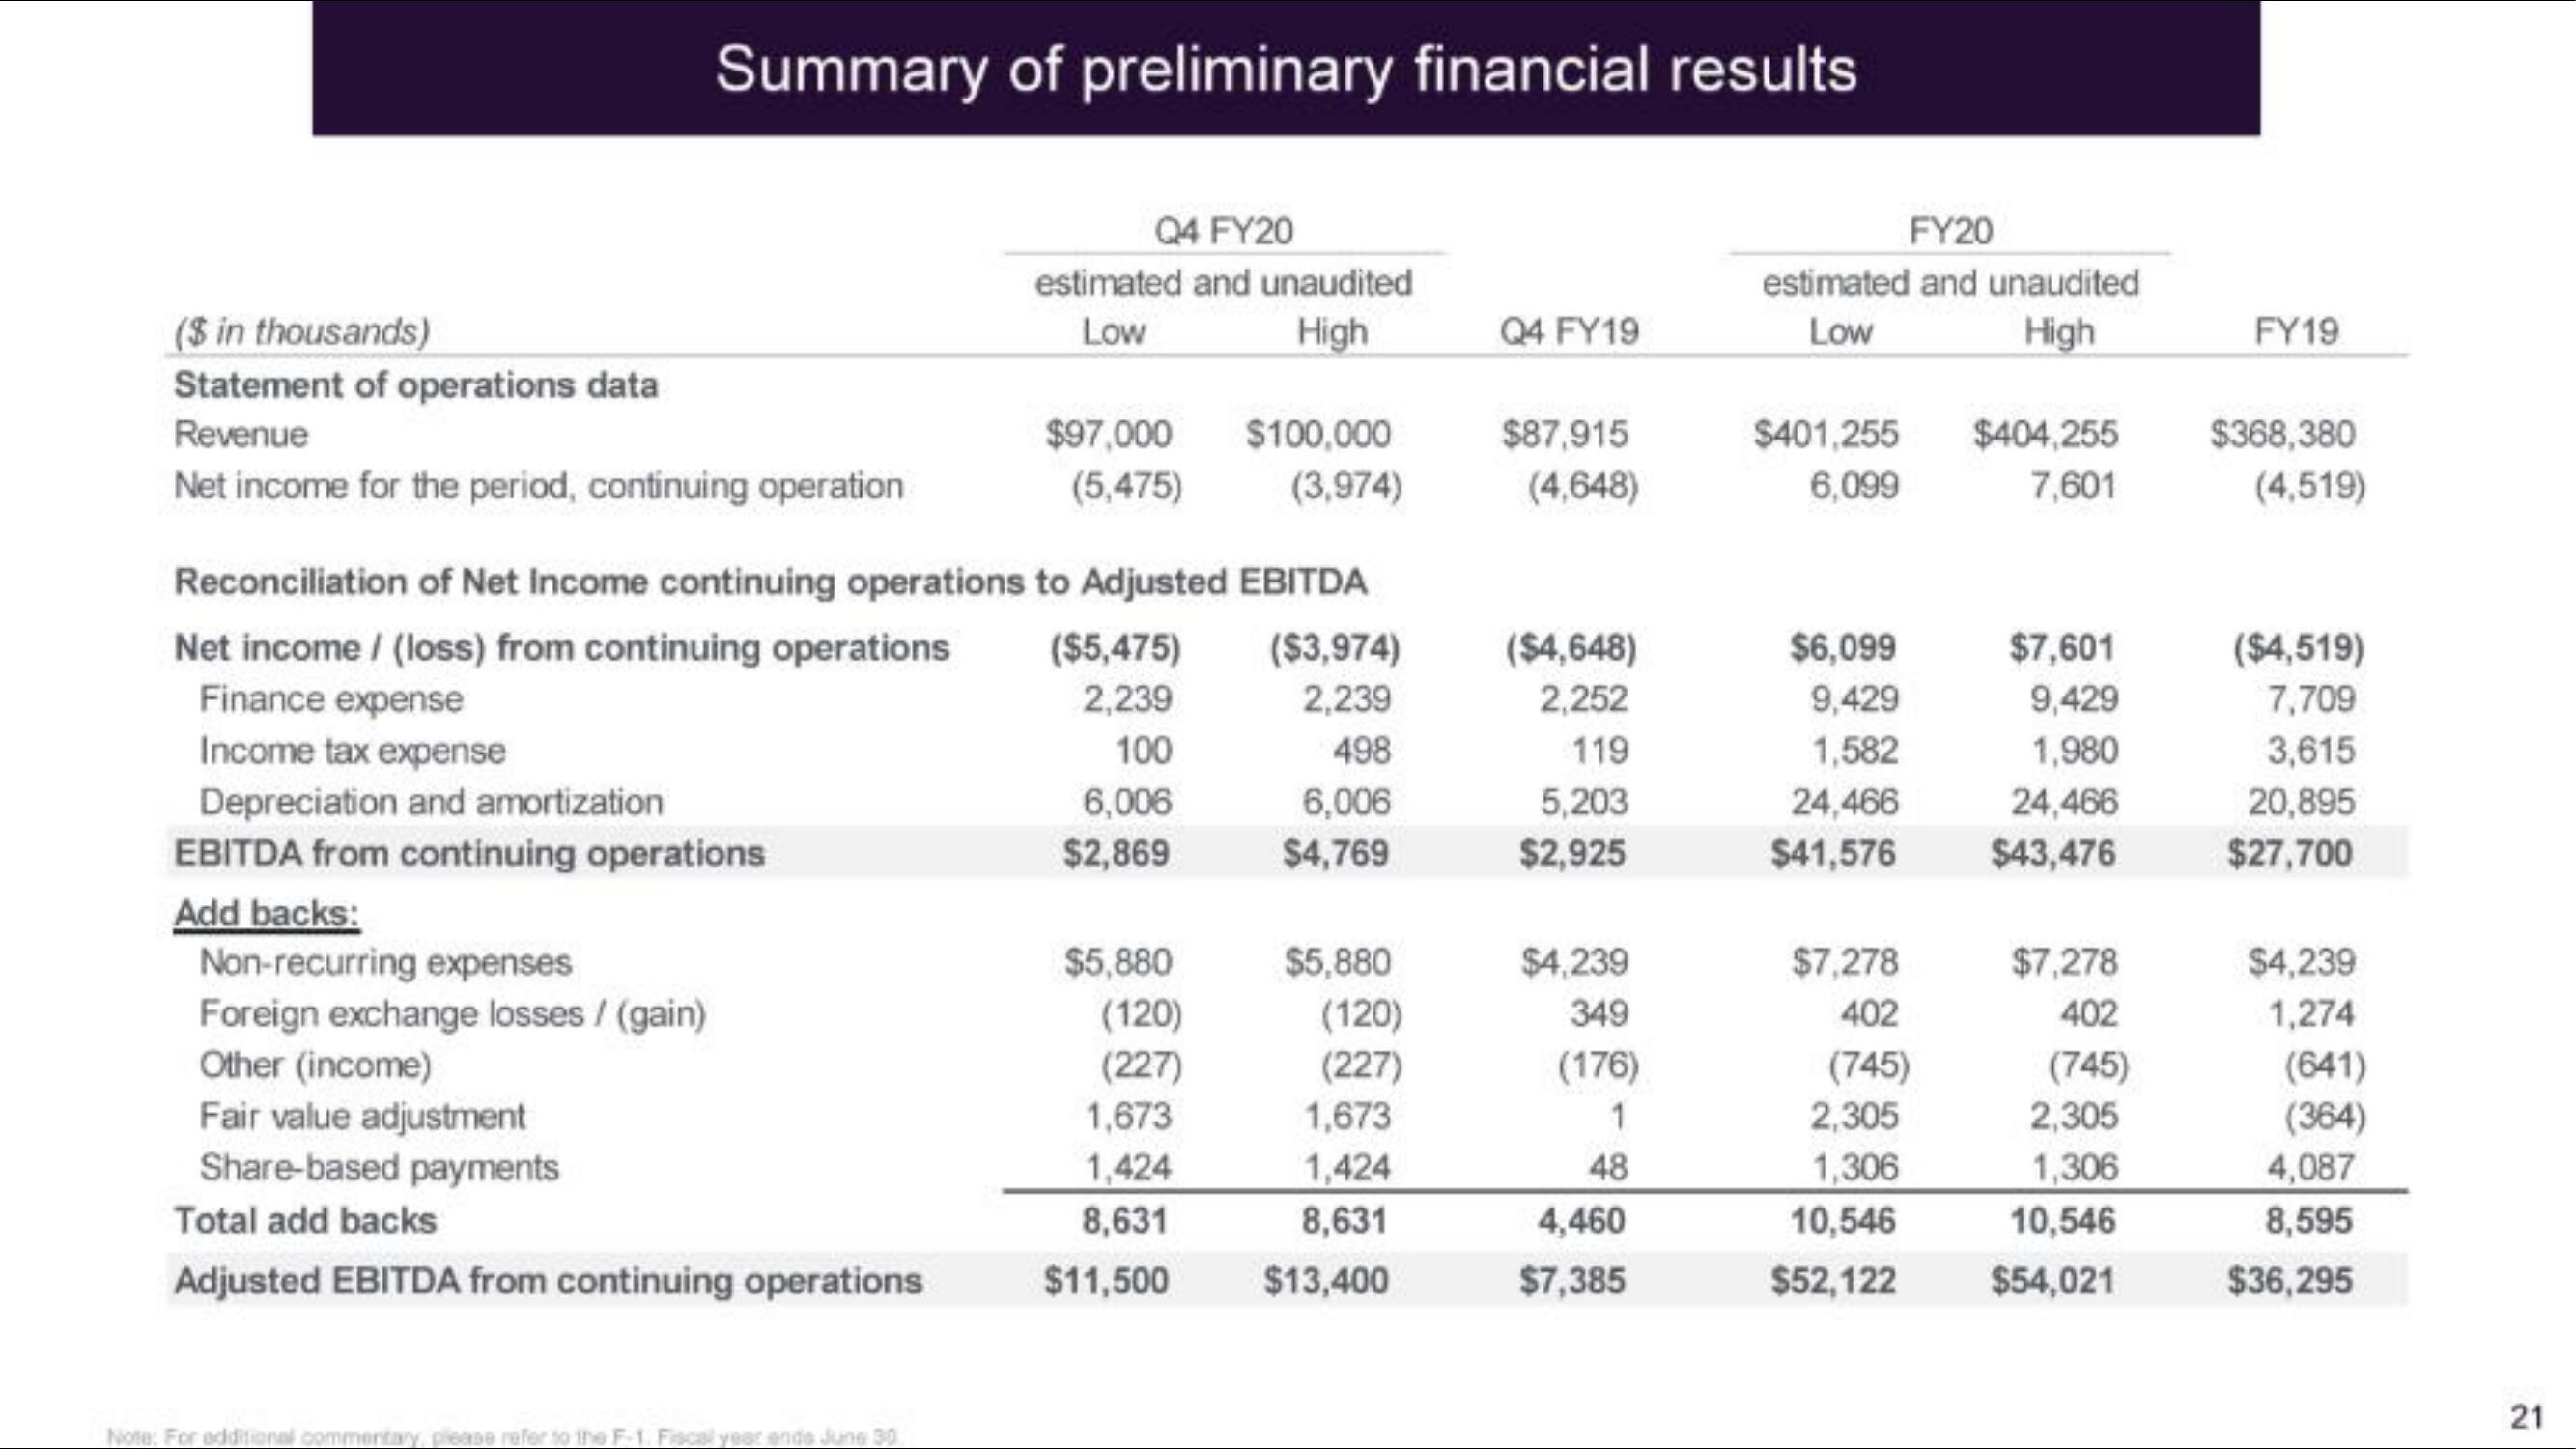
Summary of preliminary financial results
($ in thousands)
Statement of operations data
Revenue
Net income for the period, continuing operation
Foreign exchange losses / (gain)
Other (income)
Fair value adjustment
Share-based payments
Total add backs
Adjusted EBITDA from continuing operations
Q4 FY20
estimated and unaudited
Low
High
Note: For additional commentary, please refer to the F-1. Fiscal year ende June 30
$97,000
(5,475)
Reconciliation of Net Income continuing operations to Adjusted EBITDA
Net income / (loss) from continuing operations ($5,475)
Finance expense
2,239
Income tax expense
100
Depreciation and amortization
6,006
EBITDA from continuing operations
$2,869
Add backs:
Non-recurring expenses
$5,880
(120)
(227)
$100,000
(3,974)
1,673
1,424
8,631
$11,500
($3,974)
2,239
498
6,006
$4,769
$5,880
(120)
(227)
1,673
1,424
8,631
$13,400
Q4 FY19
$87,915
(4,648)
($4,648)
2,252
119
5,203
$2,925
$4,239
349
(176)
1
48
4,460
$7,385
FY20
estimated and unaudited
Low
High
$401,255
6,099
$6,099
9,429
1,582
24,466
$41,576
$7,278
402
(745)
2,305
1,306
10,546
$52,122
$404,255
7,601
$7,601
9,429
1,980
24,466
$43,476
$7,278
402
(745)
2,305
1,306
10,546
$54,021
FY19
$368,380
(4,519)
($4,519)
7,709
3,615
20,895
$27,700
$4,239
1,274
(641)
(364)
4,087
8,595
$36,295
21View entire presentation