Baird Investment Banking Pitch Book
RECAP OF KEY DRIVERS OF AR SHARE PERFORMANCE
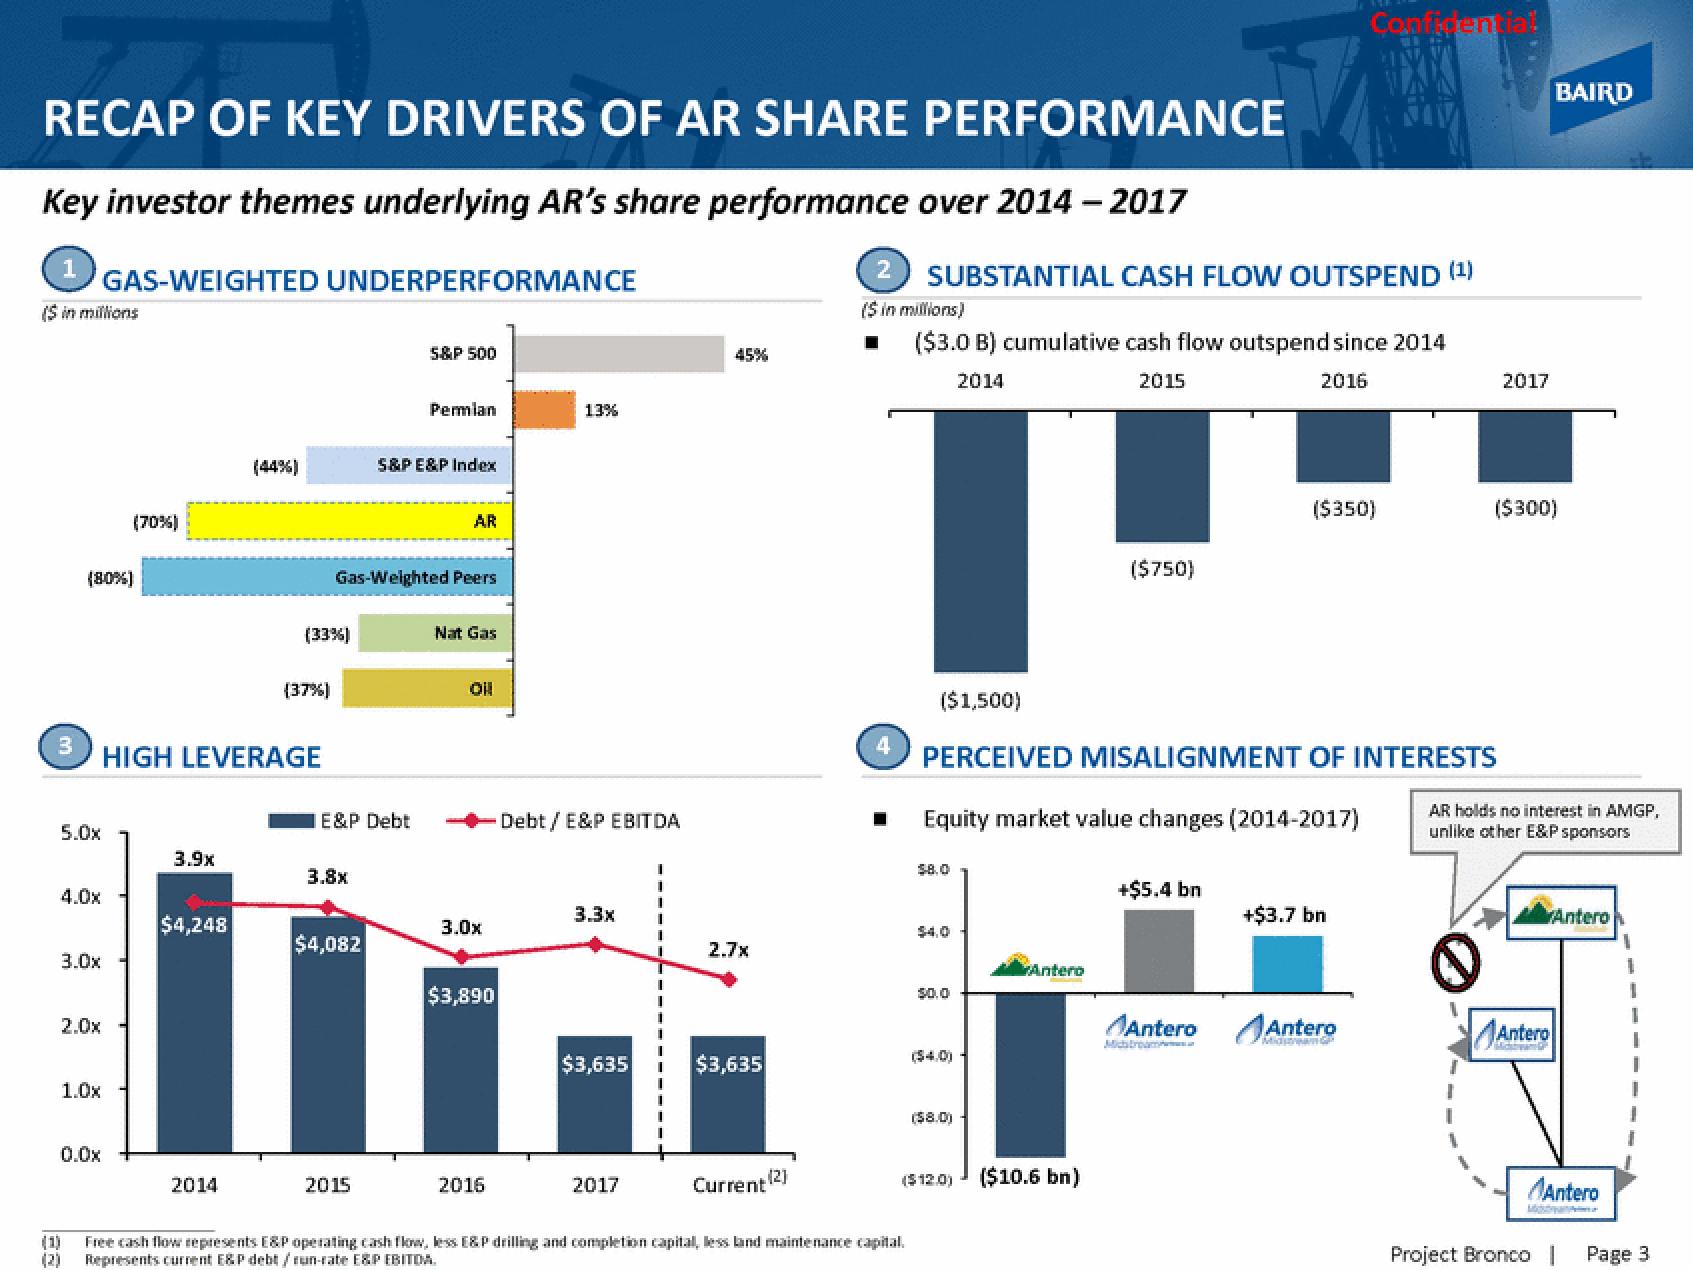
Key investor themes underlying AR's share performance over 2014 - 2017
1
($ in millions
3
5.0x
(80%)
4.0x
3.0x
2.0x
1.0x
GAS-WEIGHTED UNDERPERFORMANCE
0.0x
(70%)
3.9x
$4,248
(44%)
HIGH LEVERAGE
2014
(33 %)
(37%)
E&P Debt
3.8x
Gas-Weighted Peers
$4,082
5&P 500
2015
Permian
S&P E&P Index
AR
Nat Gas
Oll
3.0x
$3,890
2016
13%
Debt / E&P EBITDA
3.3x
$3,635
2017
45%
2.7x
$3,635
(2]
Current
2
($ in millions)
($3.0 B) cumulative cash flow outspend since 2014
2014
2015
2016
4
SUBSTANTIAL CASH FLOW OUTSPEND (¹)
(1)
Free cash flow represents E&P operating cash flow, less E&P drilling and completion capital, less land maintenance capital.
(2) Represents current E&P debt/run-rate E&P EBITDA.
☐ Equity market value changes (2014-2017)
$4,0
$0.0
($1,500)
PERCEIVED MISALIGNMENT OF INTERESTS
($4.0)
($8.0)
($12.0)
($750)
Antero
($10.6 bn)
+$5.4 bn
Antero
Confidential
($350)
Michstrom
+$3.7 bn
Antero
2017
($300)
BAIRD
AR holds no interest in AMGP,
unlike other E&P sponsors
Antero
Antero
Antero
Project Bronco |
Page 3View entire presentation