HSBC Results Presentation Deck
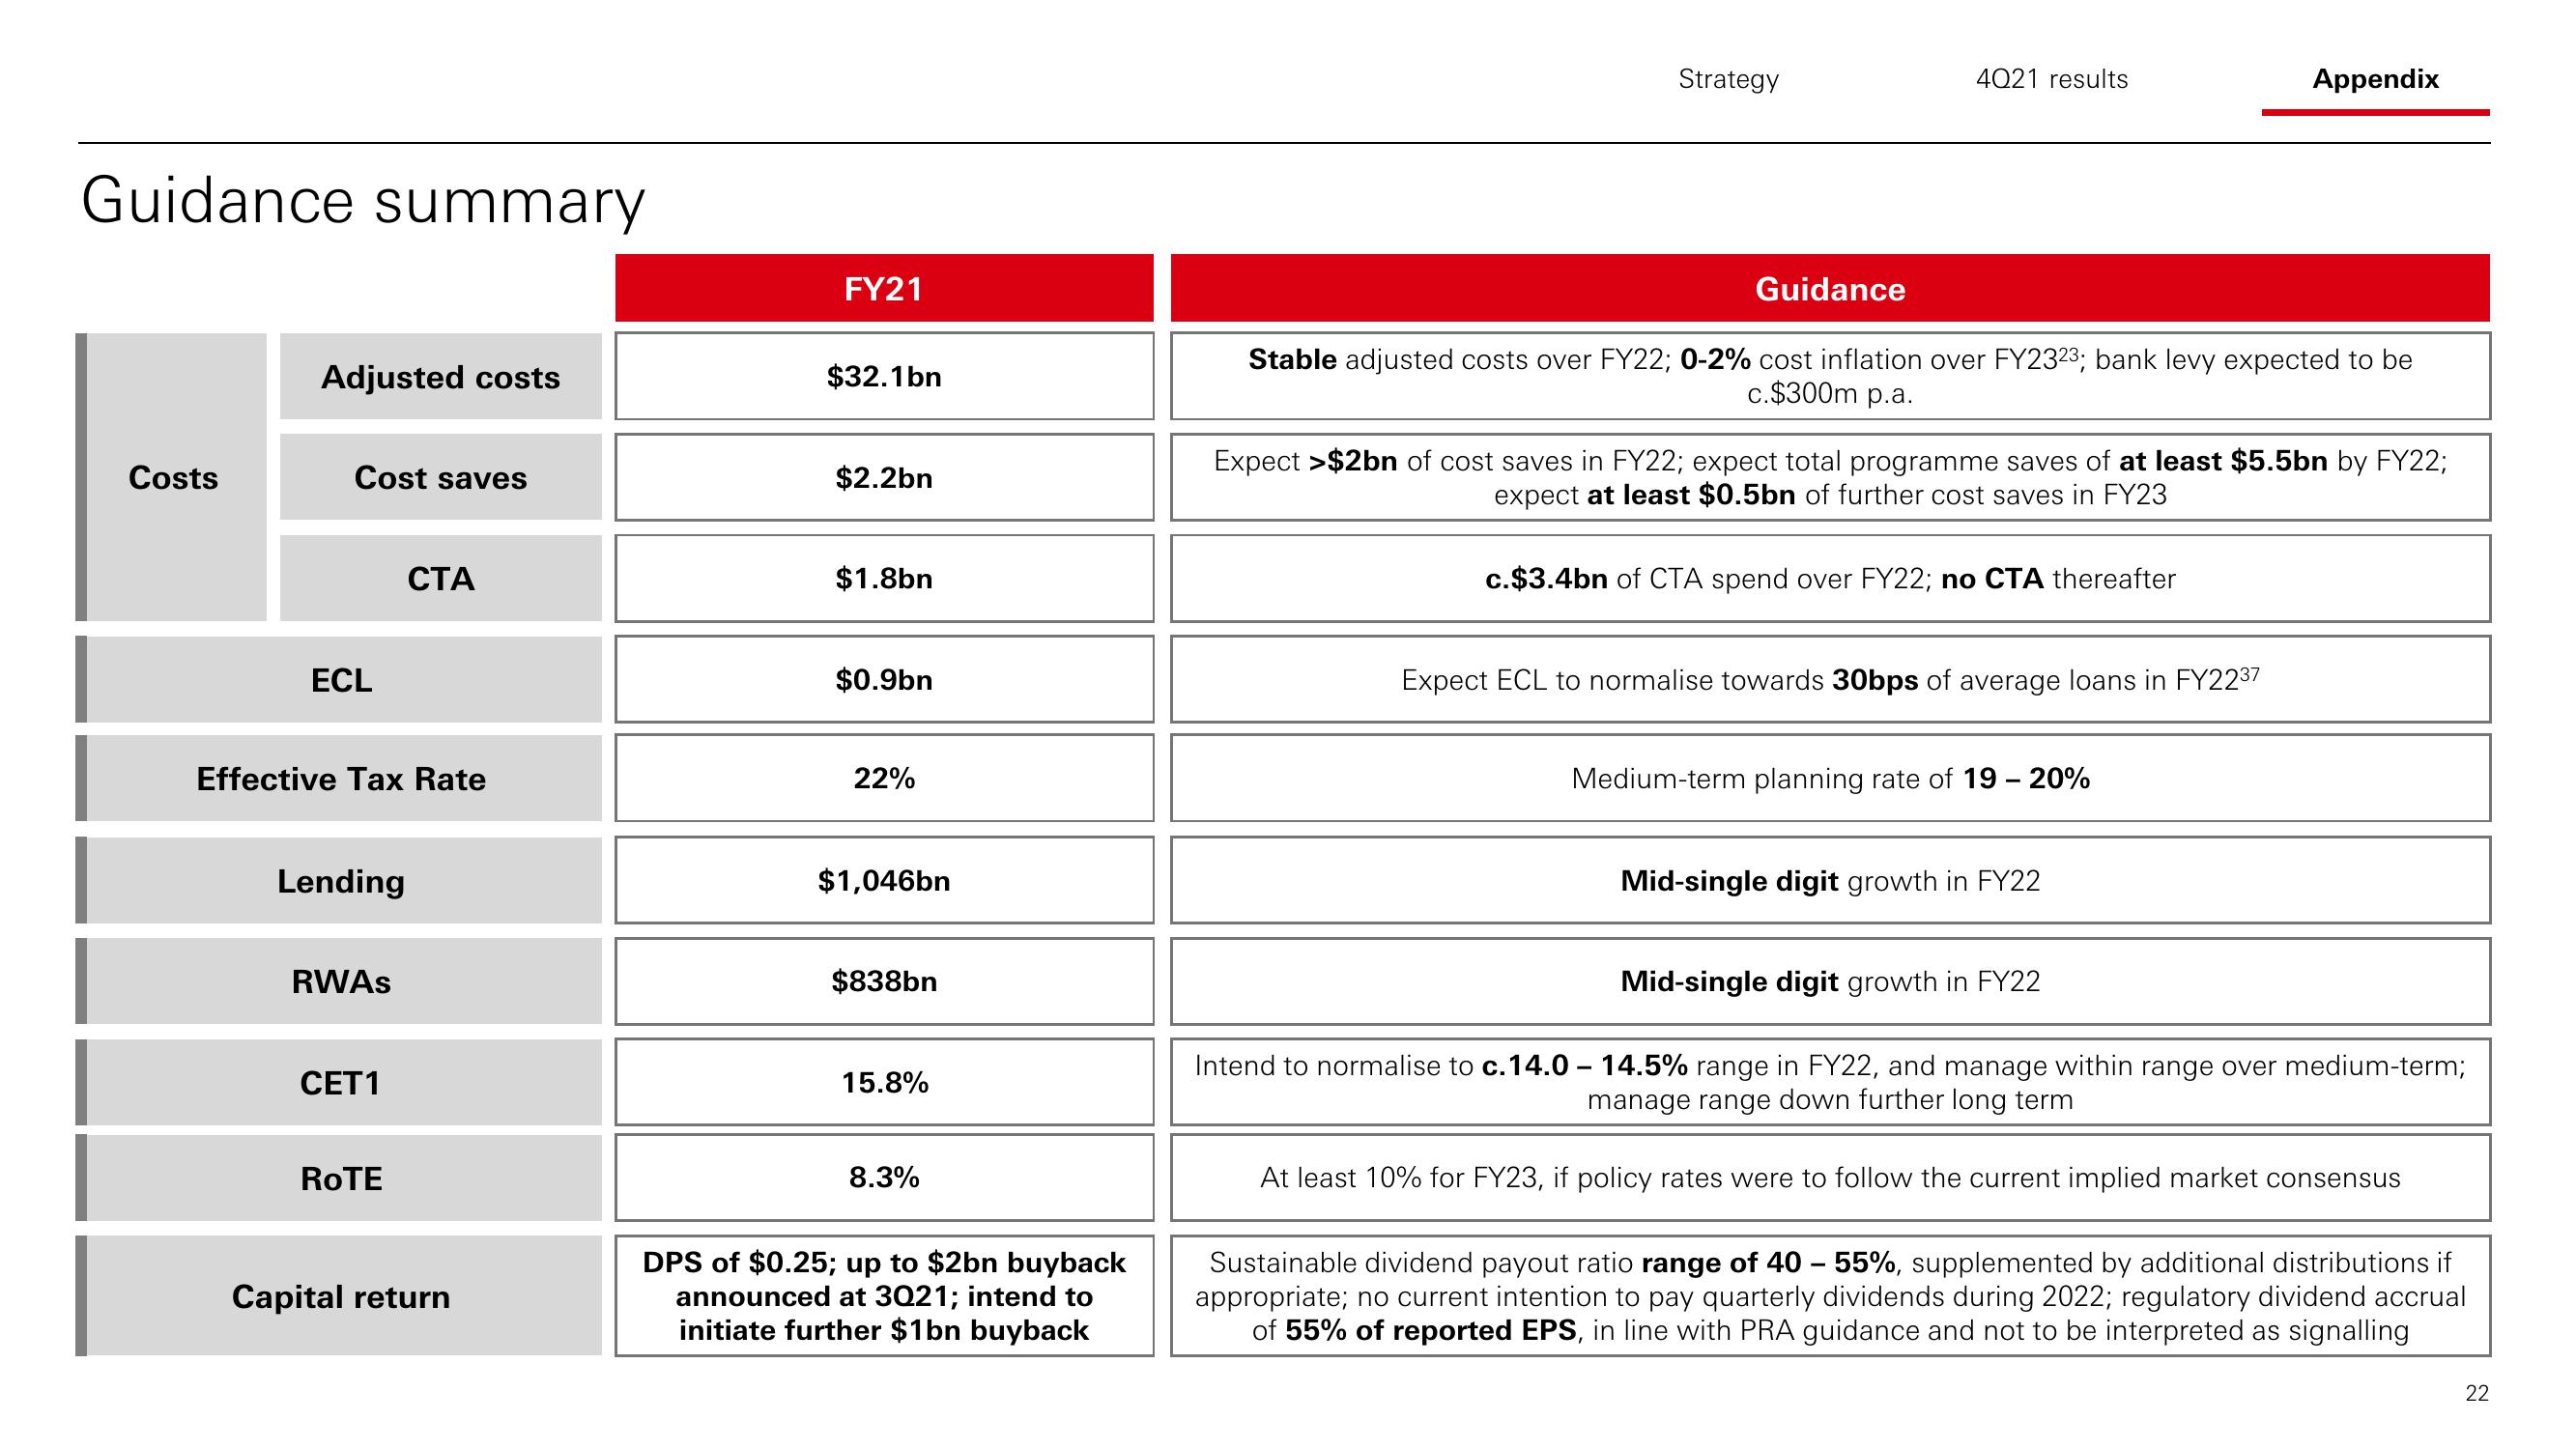
Guidance summary
Costs
Adjusted costs
Cost saves
ECL
Effective Tax Rate
Lending
RWAS
CET1
CTA
ROTE
Capital return
FY21
$32.1bn
$2.2bn
$1.8bn
$0.9bn
22%
$1,046bn
$838bn
15.8%
8.3%
DPS of $0.25; up to $2bn buyback
announced at 3021; intend to
initiate further $1bn buyback
Strategy
Guidance
4021 results
Stable adjusted costs over FY22; 0-2% cost inflation over FY2323; bank levy expected to be
c.$300m p.a.
Expect >$2bn of cost saves in FY22; expect total programme saves of at least $5.5bn by FY22;
expect at least $0.5bn of further cost saves in FY23
c.$3.4bn of CTA spend over FY22; no CTA thereafter
Expect ECL to normalise towards 30bps of average loans in FY2237
Medium-term planning rate of 19 - 20%
Appendix
Mid-single digit growth in FY22
Mid-single digit growth in FY22
Intend to normalise to c.14.0 14.5% range in FY22, and manage within range over medium-term;
manage range down further long term
At least 10% for FY23, if policy rates were to follow the current implied market consensus
Sustainable dividend payout ratio range of 40 - 55%, supplemented by additional distributions if
appropriate; no current intention to pay quarterly dividends during 2022; regulatory dividend accrual
of 55% of reported EPS, in line with PRA guidance and not to be interpreted as signalling
22View entire presentation