Third Quarter 2019 Results
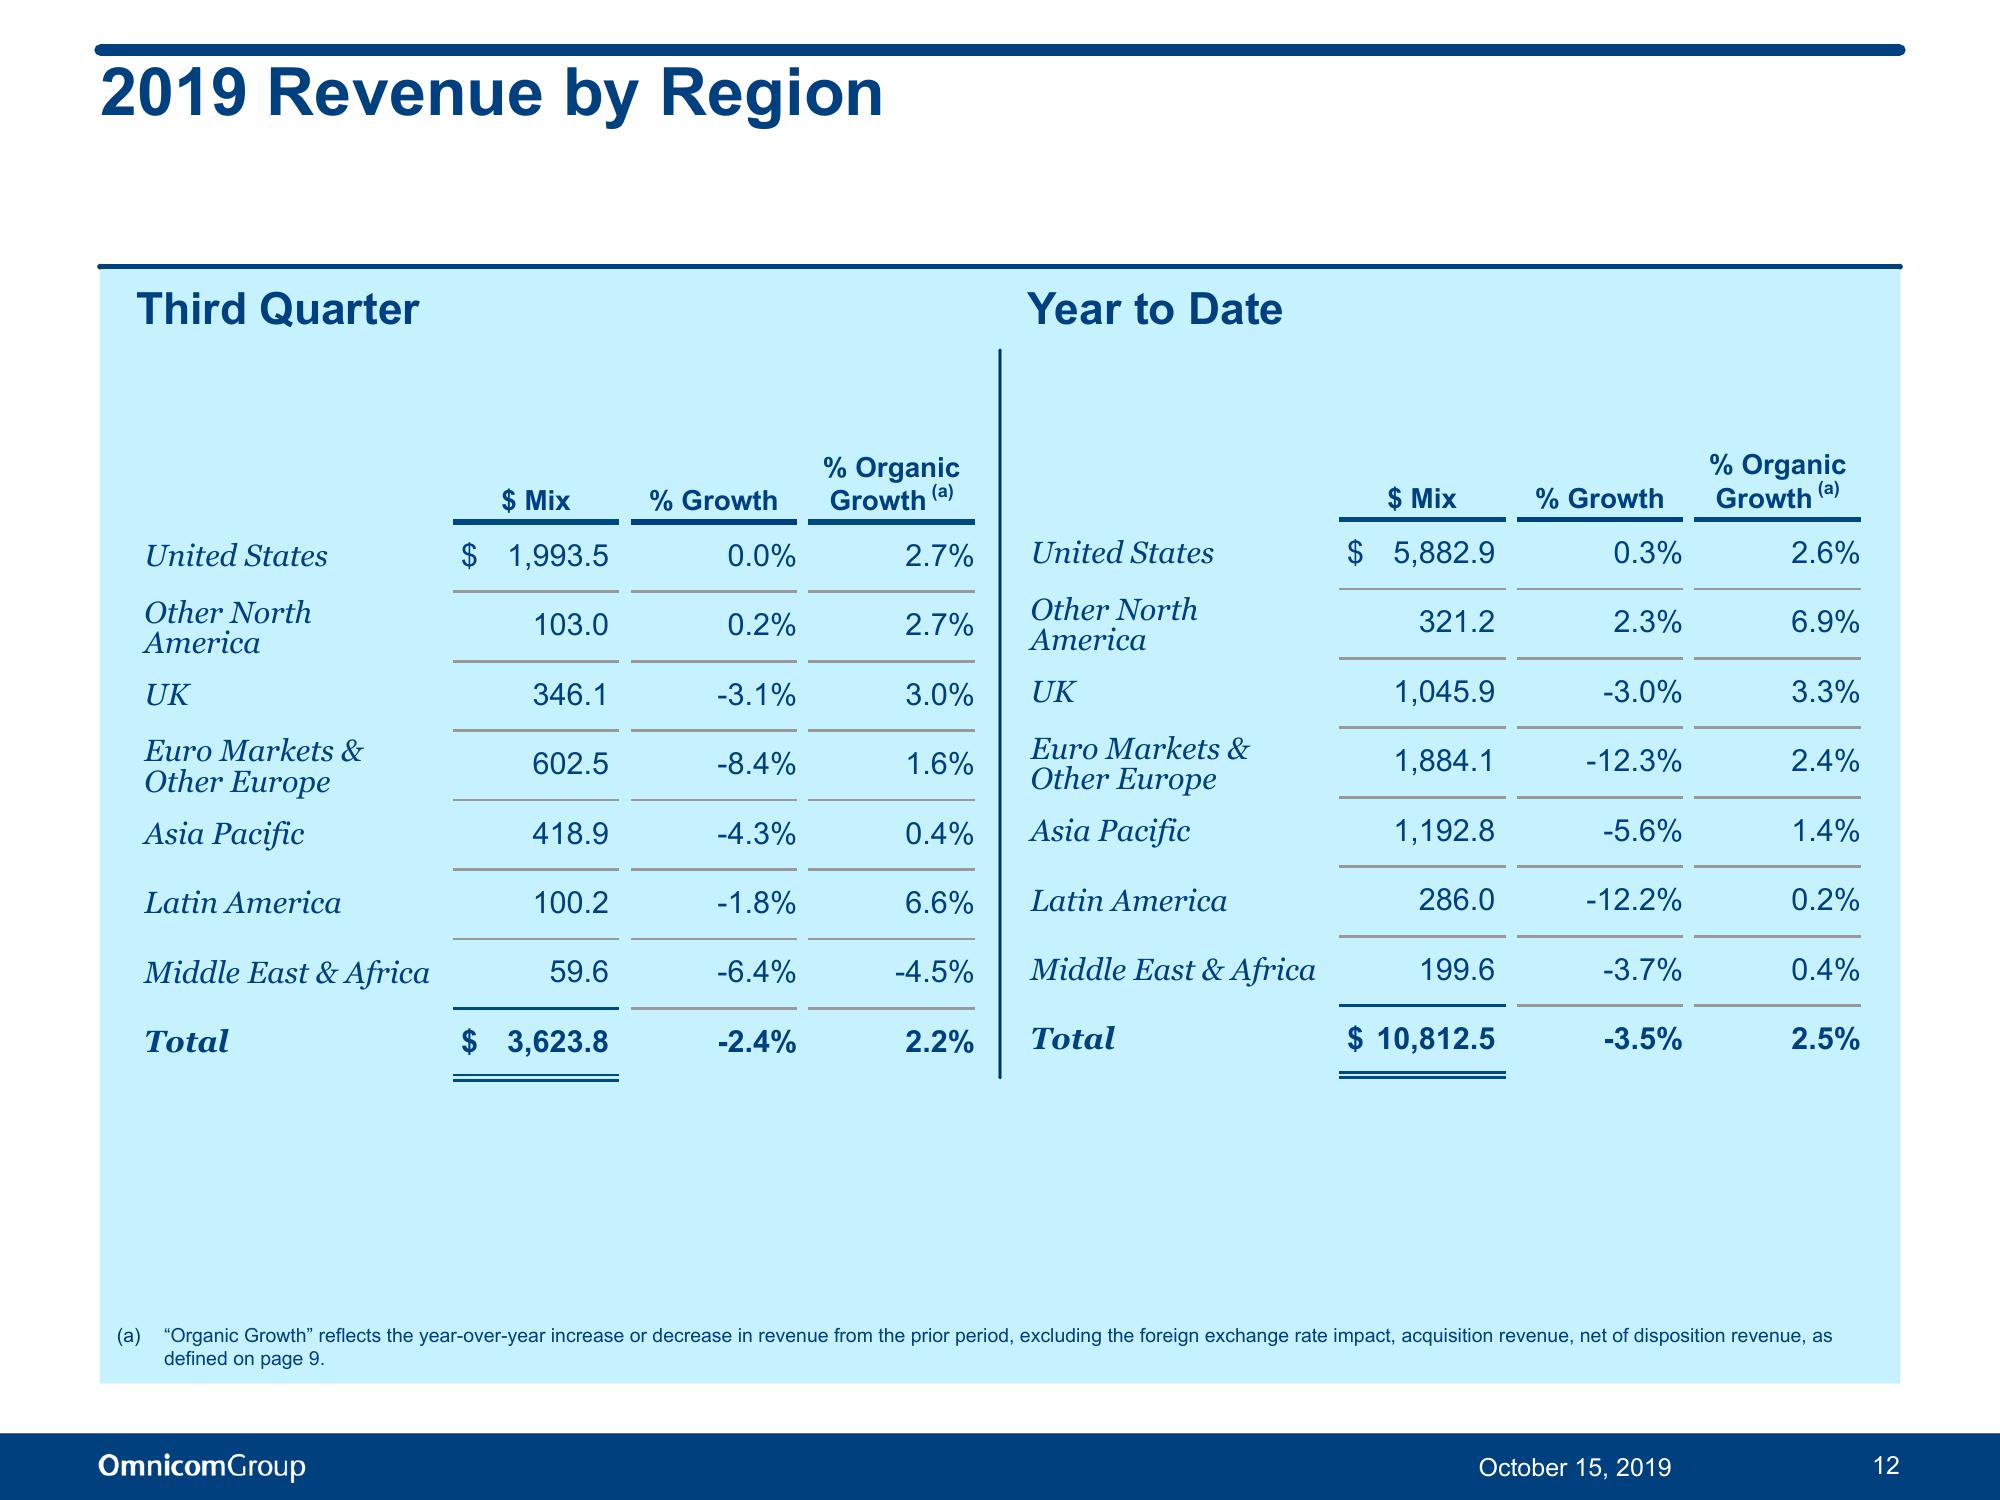
2019 Revenue by Region
Third Quarter
United States
Other North
America
UK
Euro Markets &
Other Europe
Asia Pacific
Latin America
Middle East & Africa
Total
$ Mix
$ 1,993.5
OmnicomGroup
103.0
346.1
602.5
418.9
100.2
59.6
$ 3,623.8
% Growth
0.0%
0.2%
-3.1%
-8.4%
-4.3%
-1.8%
-6.4%
-2.4%
% Organic
Growth
(a)
2.7%
2.7%
3.0%
1.6%
0.4%
6.6%
-4.5%
Year to Date
United States
Other North
America
UK
Euro Markets &
Other Europe
Asia Pacific
Latin America
Middle East & Africa
2.2% Total
$ Mix
$5,882.9
321.2
1,045.9
1,884.1
1,192.8
286.0
199.6
$ 10,812.5
% Growth
0.3%
2.3%
-3.0%
-12.3%
-5.6%
-12.2%
-3.7%
-3.5%
% Organic
(a)
Growth
2.6%
October 15, 2019
6.9%
3.3%
2.4%
1.4%
0.2%
0.4%
(a) "Organic Growth" reflects the year-over-year increase or decrease in revenue from the prior period, excluding the foreign exchange rate impact, acquisition revenue, net of disposition revenue, as
defined on page 9.
2.5%
12View entire presentation