Lyft Results Presentation Deck
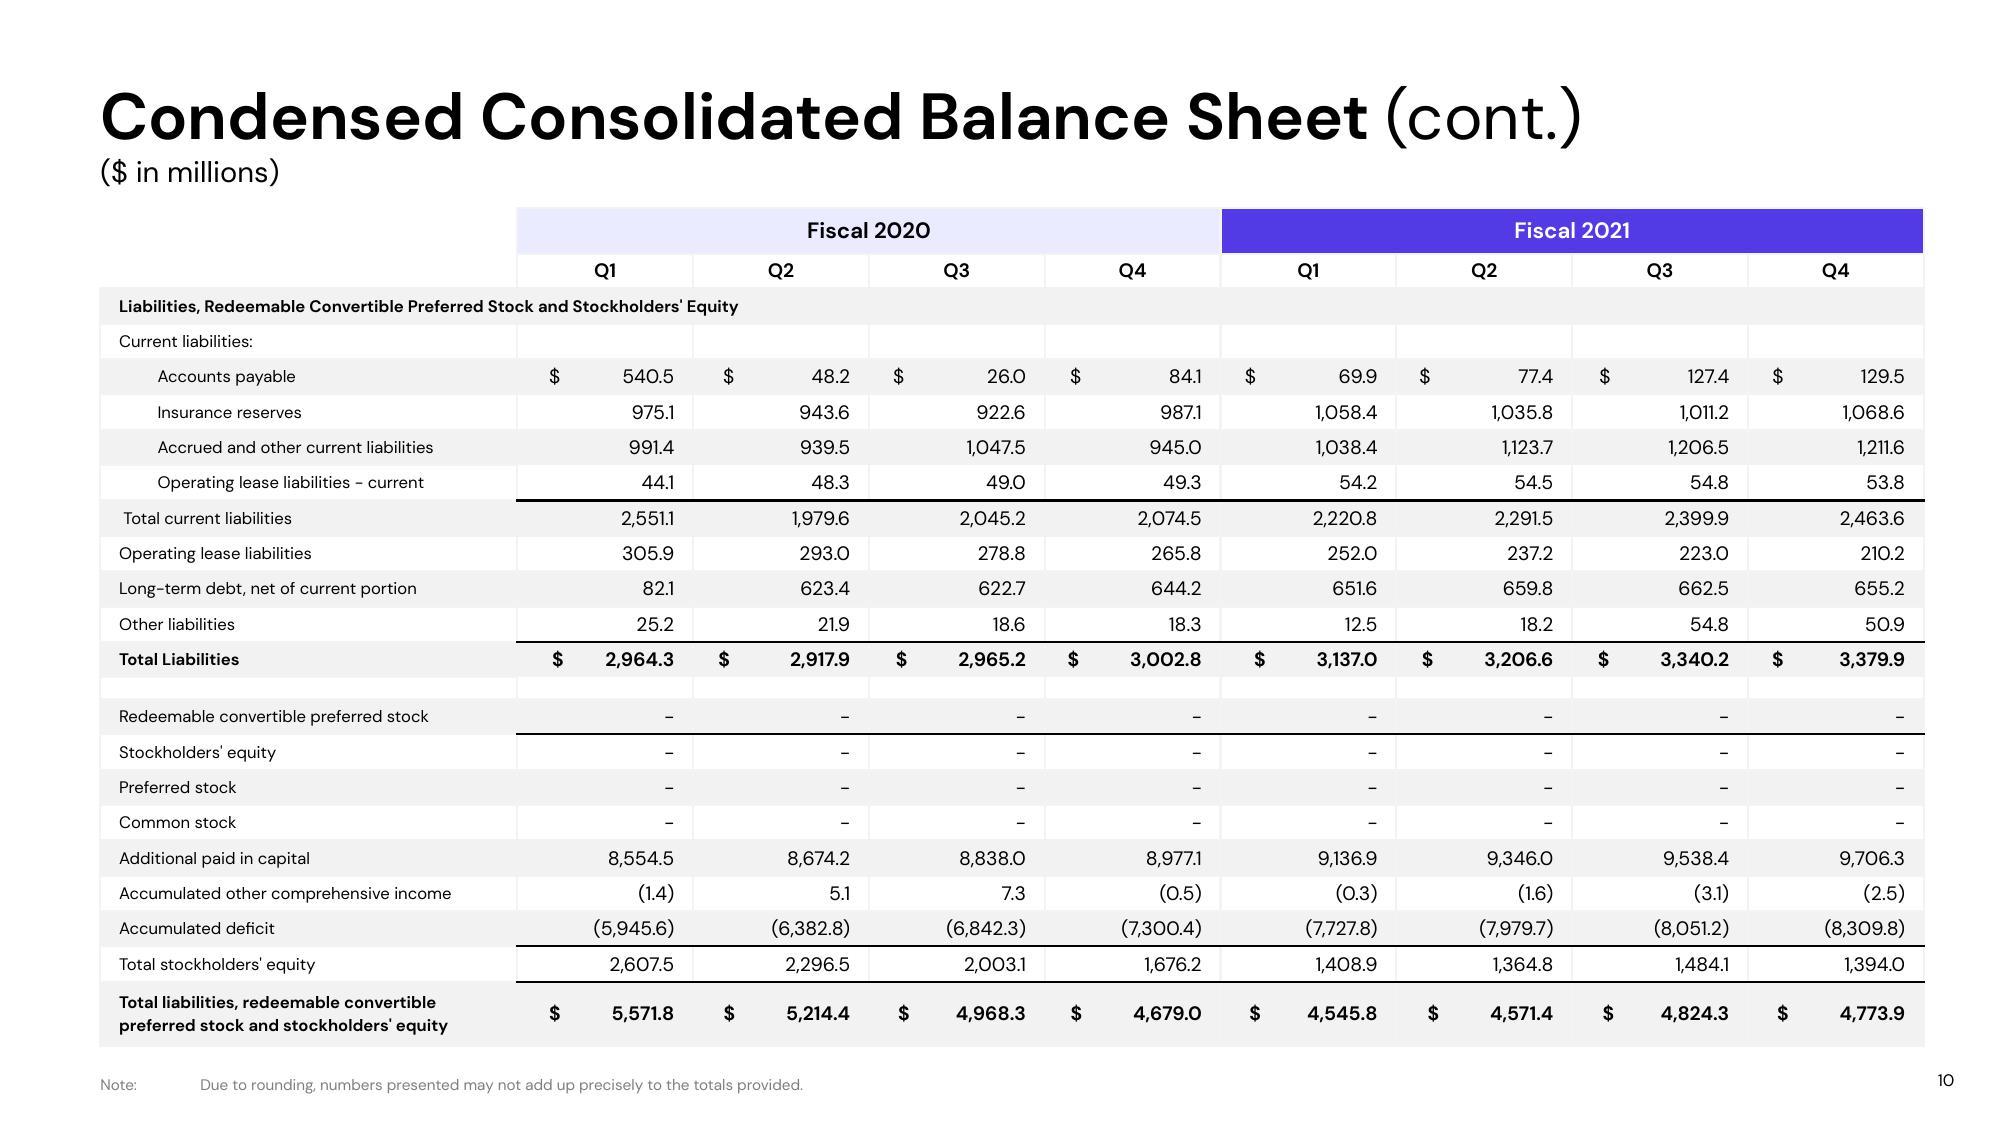
Condensed Consolidated Balance Sheet (cont.)
($ in millions)
Q1
Liabilities, Redeemable Convertible Preferred Stock and Stockholders' Equity
Current liabilities:
Accounts payable
Insurance reserves
Accrued and other current liabilities
Operating lease liabilities current
Total current liabilities
Operating lease liabilities
Long-term debt, net of current portion
Other liabilities
Total Liabilities
Redeemable convertible preferred stock
Stockholders' equity
Preferred stock
Common stock
Additional paid in capital
Accumulated other comprehensive income
Accumulated deficit
Total stockholders' equity
Total liabilities, redeemable convertible
preferred stock and stockholders' equity
Note:
$
540.5
975.1
991.4
44.1
2,551.1
305.9
82.1
25.2
$ 2,964.3
$
8,554.5
(1.4)
(5,945.6)
2,607.5
5,571.8
$
$
$
Q2
Fiscal 2020
48.2 $
943.6
939.5
48.3
1,979.6
293.0
623.4
21.9
2,917.9
8,674.2
5.1
(6,382.8)
2,296.5
5,214.4
Due to rounding, numbers presented may not add up precisely to the totals provided.
$
$
Q3
26.0 $
922.6
1,047.5
49.0
2,045.2
278.8
622.7
18.6
2,965.2
8,838.0
7.3
(6,842.3)
2,003.1
4,968.3
$
$
Q4
84.1
987.1
945.0
49.3
2,074.5
265.8
644.2
18.3
3,002.8
8,977.1
(0.5)
(7,300.4)
1,676.2
4,679.0
$
$
$
Q1
69.9
1,058.4
1,038.4
54.2
2,220.8
252.0
651.6
12.5
3,137.0
9,136.9
(0.3)
(7,727.8)
1,408.9
4,545.8
$
$
$
Q2
Fiscal 2021
77.4 $
1,035.8
1,123.7
54.5
2,291.5
237.2
659.8
18.2
3,206.6
9,346.0
(1.6)
(7,979.7)
1,364.8
4,571.4
$
$
Q3
127.4
1,011.2
1,206.5
54.8
2,399.9
223.0
662.5
54.8
3,340.2
9,538.4
(3.1)
(8,051.2)
1,484.1
4,824.3
$
$
$
Q4
129.5
1,068.6
1,211.6
53.8
2,463.6
210.2
655.2
50.9
3,379.9
9,706.3
(2.5)
(8,309.8)
1,394.0
4,773.9
10View entire presentation