Rally SPAC Presentation Deck
Assumptions: Lines offering
KPIs for our primary revenue driver
ASSUMPTIONS COMMENTARY¹
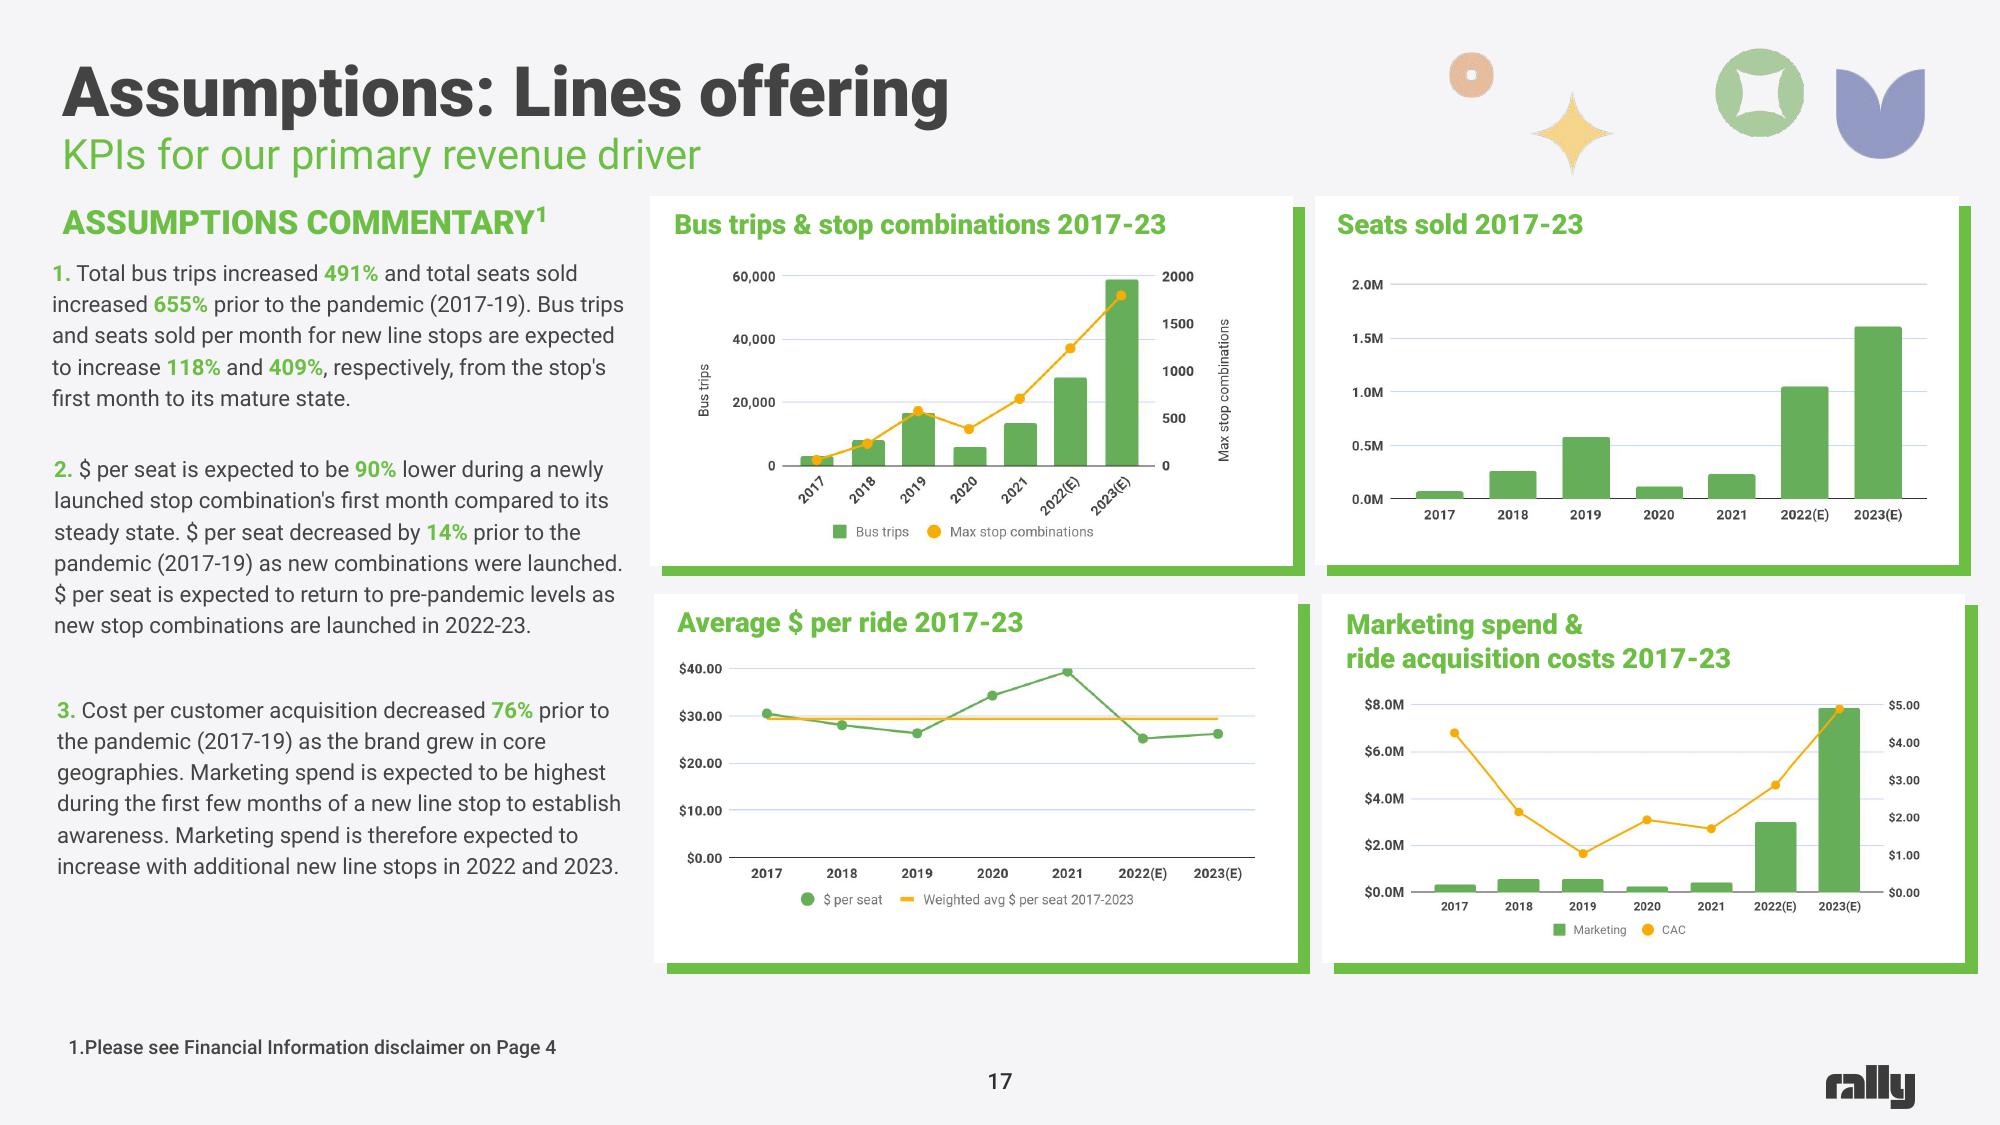
1. Total bus trips increased 491% and total seats sold
increased 655% prior to the pandemic (2017-19). Bus trips
and seats sold per month for new line stops are expected
to increase 118% and 409%, respectively, from the stop's
first month to its mature state.
2. $ per seat is expected to be 90% lower during a newly
launched stop combination's first month compared to its
steady state. $ per seat decreased by 14% prior to the
pandemic (2017-19) as new combinations were launched.
$ per seat is expected to return to pre-pandemic levels as
new stop combinations are launched in 2022-23.
3. Cost per customer acquisition decreased 76% prior to
the pandemic (2017-19) as the brand grew in core
geographies. Marketing spend is expected to be highest
during the first few months of a new line stop to establish
awareness. Marketing spend is therefore expected to
increase with additional new line stops in 2022 and 2023.
1.Please see Financial Information disclaimer on Page 4
Bus trips & stop combinations 2017-23
Bus trips
$40.00
$30.00
$20.00
$10.00
60,000
$0.00
40,000
20,000
2017
2017
2018
Average $ per ride 2017-23
Bus trips
2019
2020
2021
Max stop combinations
2022(E)
17
2023(E)
2019
2020
2021
2018
$ per seat - Weighted avg $ per seat 2017-2023
202
2000
1500
1000
500
0
Max stop combinations
2023
Seats sold 2017-23
2.0M
1.5M
1.0M
0.5M
0.0M
$8.0M
$6.0M
$4.0M
$2.0M
2017
Marketing spend &
ride acquisition costs 2017-23
$0.0M
2018
2017
2019
2018
2019
2020
Marketing
2020
2021 2022(E) 2023(E)
CAC
2021 2022(E) 2023(E)
$5.00
$4.00
$3.00
$2.00
$1.00
$0.00
rallyView entire presentation