Barclays Investment Banking Pitch Book
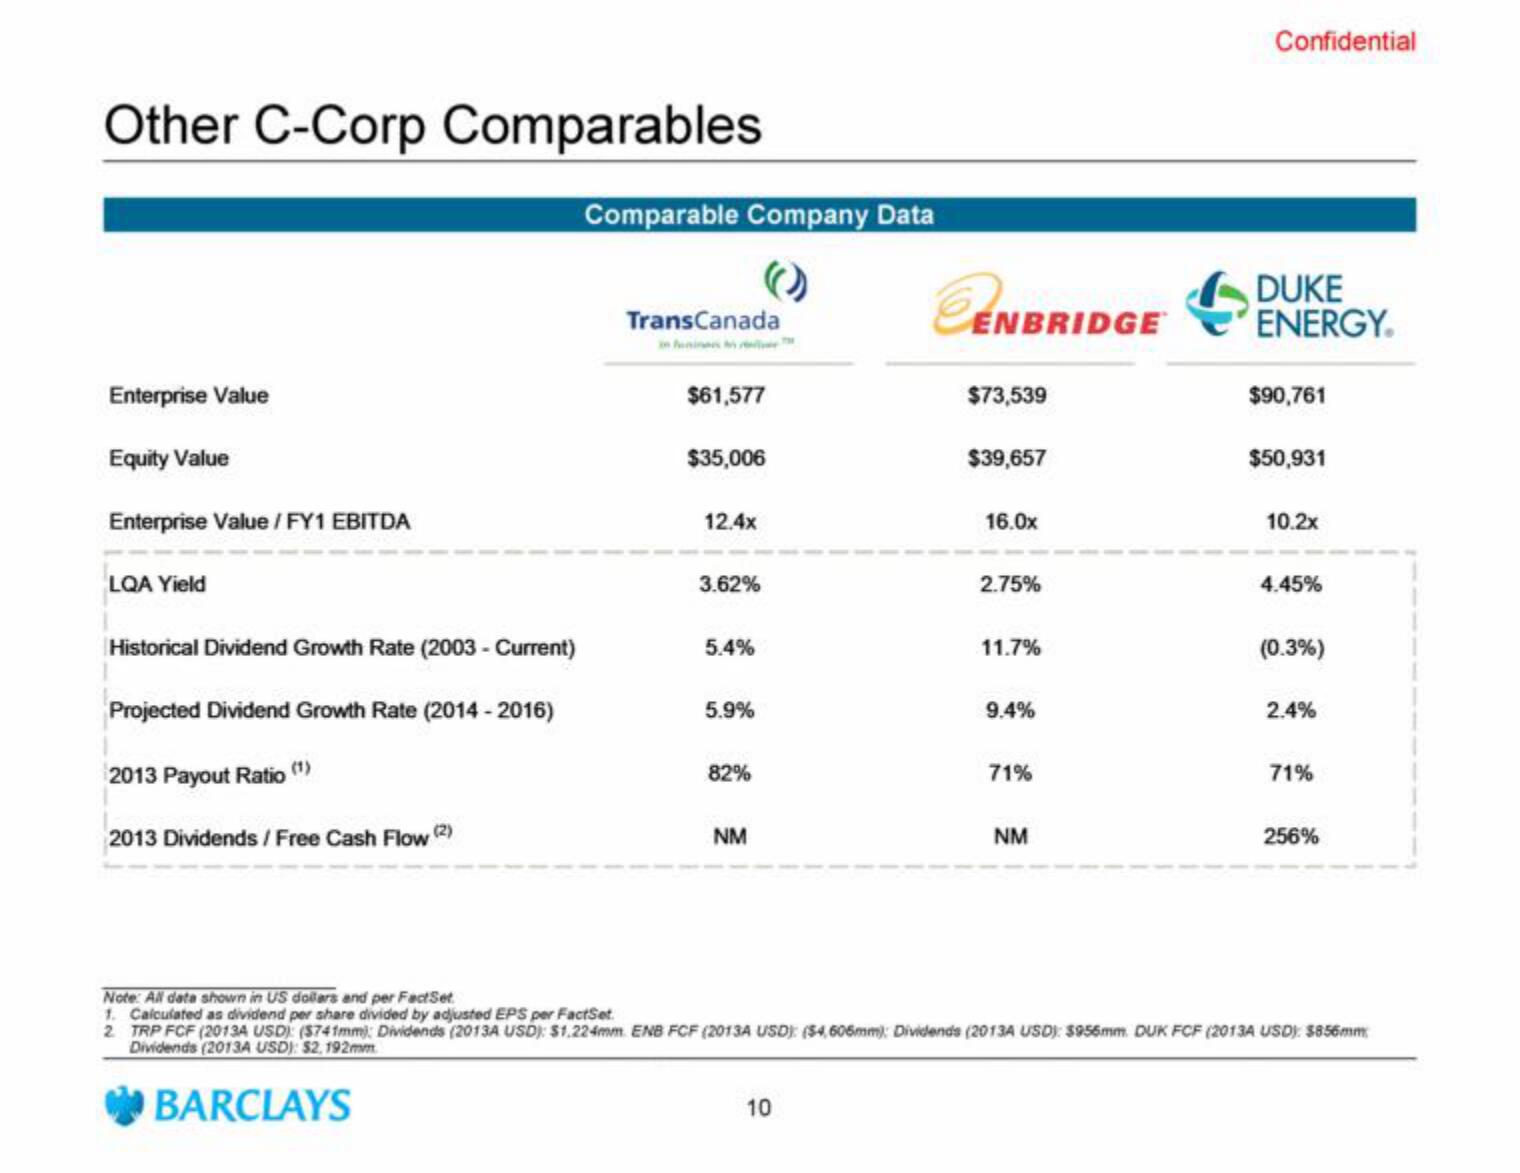
Other C-Corp Comparables
Enterprise Value
Equity Value
Enterprise Value /FY1 EBITDA
LQA Yield
Historical Dividend Growth Rate (2003- Current)
Projected Dividend Growth Rate (2014-2016)
2013 Payout Ratio (¹)
2013 Dividends / Free Cash Flow (2)
Comparable Company Data
TransCanada
$61,577
$35,006
12.4x
3.62%
5.4%
5.9%
82%
NM
ENBRIDGE
10
$73,539
$39,657
16.0x
2.75%
11.7%
9.4%
71%
NM
Confidential
DUKE
ENERGY.
$90,761
$50,931
10.2x
4.45%
(0.3%)
2.4%
71%
256%
Note: All data shown in US dollars and per FactSet
1. Calculated as dividend per share divided by adjusted EPS per FactSet
2. TRP FCF (2013A USD) ($741mm): Dividends (2013A USD): $1,224mm ENB FCF (2013A USD): ($4,606mm): Dividends (2013A USD): $956mm DUK FCF (2013A USD) $856mm
Dividends (2013A USD): $2,192mm
BARCLAYSView entire presentation