Comcast Results Presentation Deck
NBCUniversal 1st Quarter 2021 Overview
Revenue
y/y%
Adj. EBITDA
y/y%
Revenue
$7,729
6
1Q20
$1,689
(9.1%)
1Q20
$7,024
Adjusted EBITDA ($M)
1Q21
(11.8%)
$1,490
($M)
1Q21
($M)
Media
Studios
Theme Parks
All percentages represent year/year growth rates.
See Notes on Slide 11
$5,036
+3.2%
$2,396
(0.6%)
$619
(33.1%)
$1,473
(3.7%)
$497
+65.7%
($61)
(170.9%)
Commentary
●
●
●
●
●
●
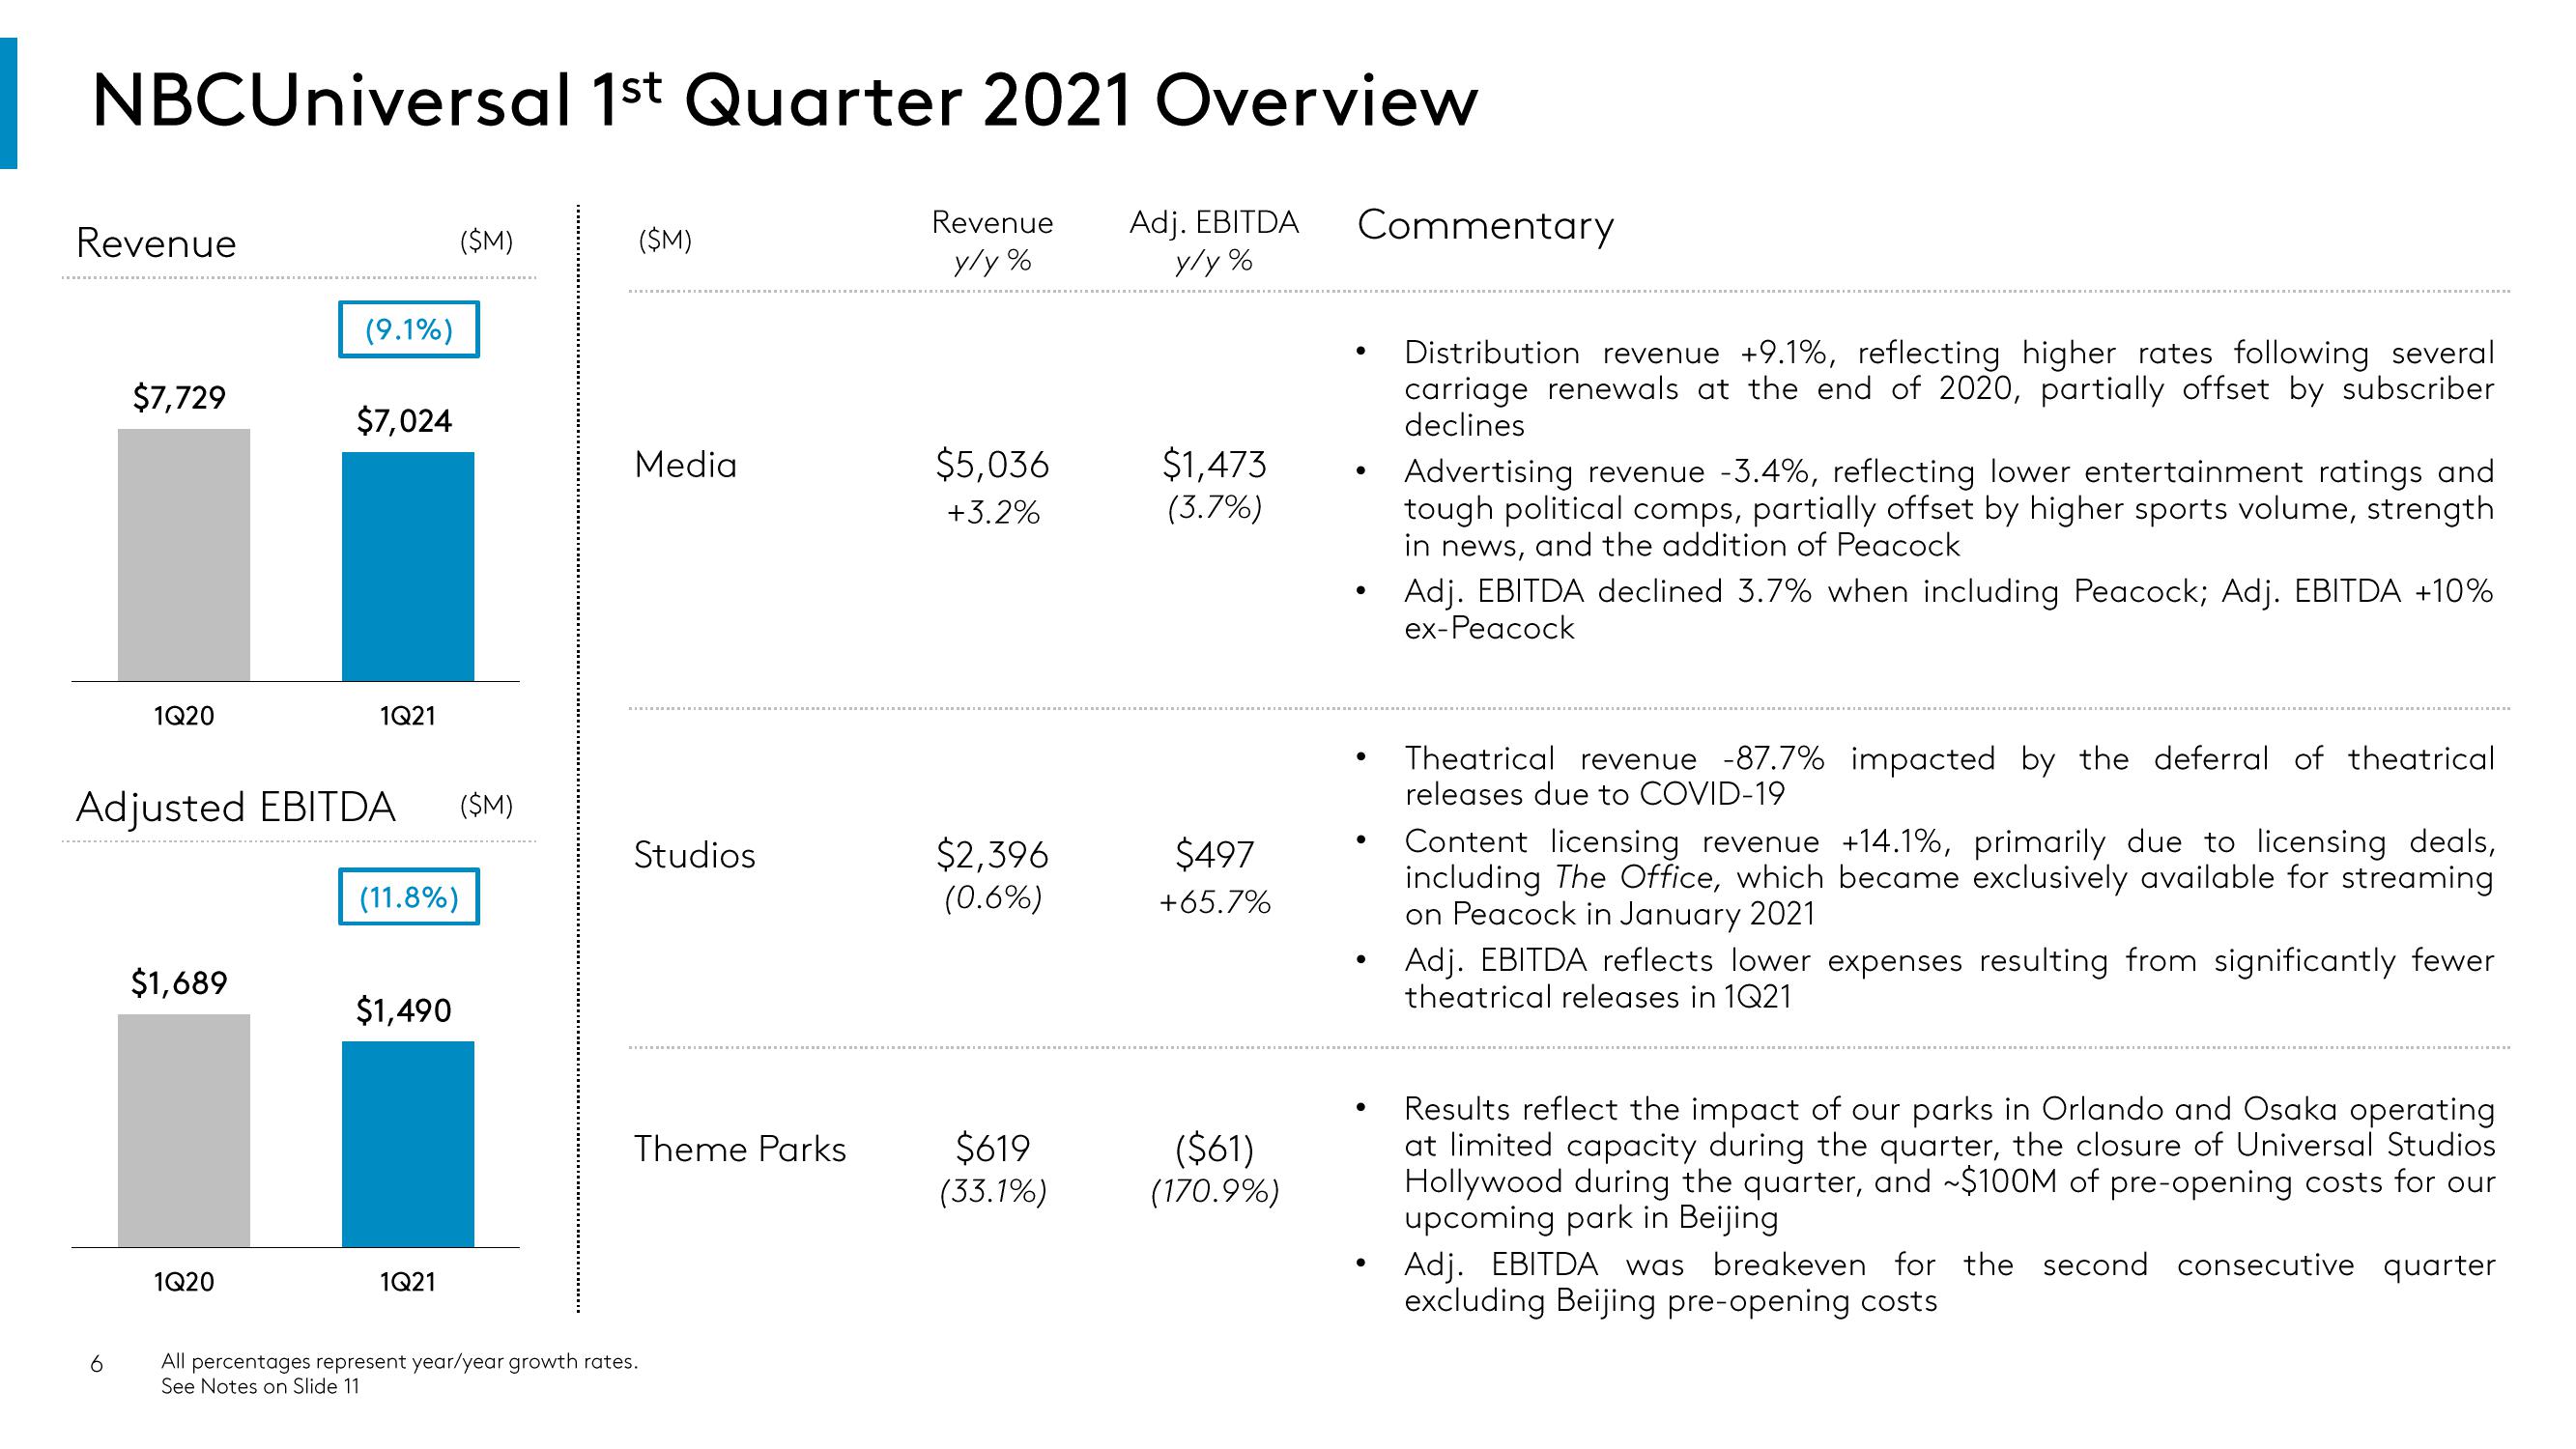
Distribution revenue +9.1%, reflecting higher rates following several
carriage renewals at the end of 2020, partially offset by subscriber
declines
Advertising revenue -3.4%, reflecting lower entertainment ratings and
tough political comps, partially offset by higher sports volume, strength
in news, and the addition of Peacock
Adj. EBITDA declined 3.7% when including Peacock; Adj. EBITDA +10%
ex-Peacock
Theatrical revenue -87.7% impacted by the deferral of theatrical
releases due to COVID-19
Content licensing revenue +14.1%, primarily due to licensing deals,
including The Office, which became exclusively available for streaming
on Peacock in January 2021
Adj. EBITDA reflects lower expenses resulting from significantly fewer
theatrical releases in 1Q21
Results reflect the impact of our parks in Orlando and Osaka operating
at limited capacity during the quarter, the closure of Universal Studios
Hollywood during the quarter, and ~$100M of pre-opening costs for our
upcoming park in Beijing
Adj. EBITDA was breakeven for the second consecutive quarter
excluding Beijing pre-opening costsView entire presentation