Lyft Results Presentation Deck
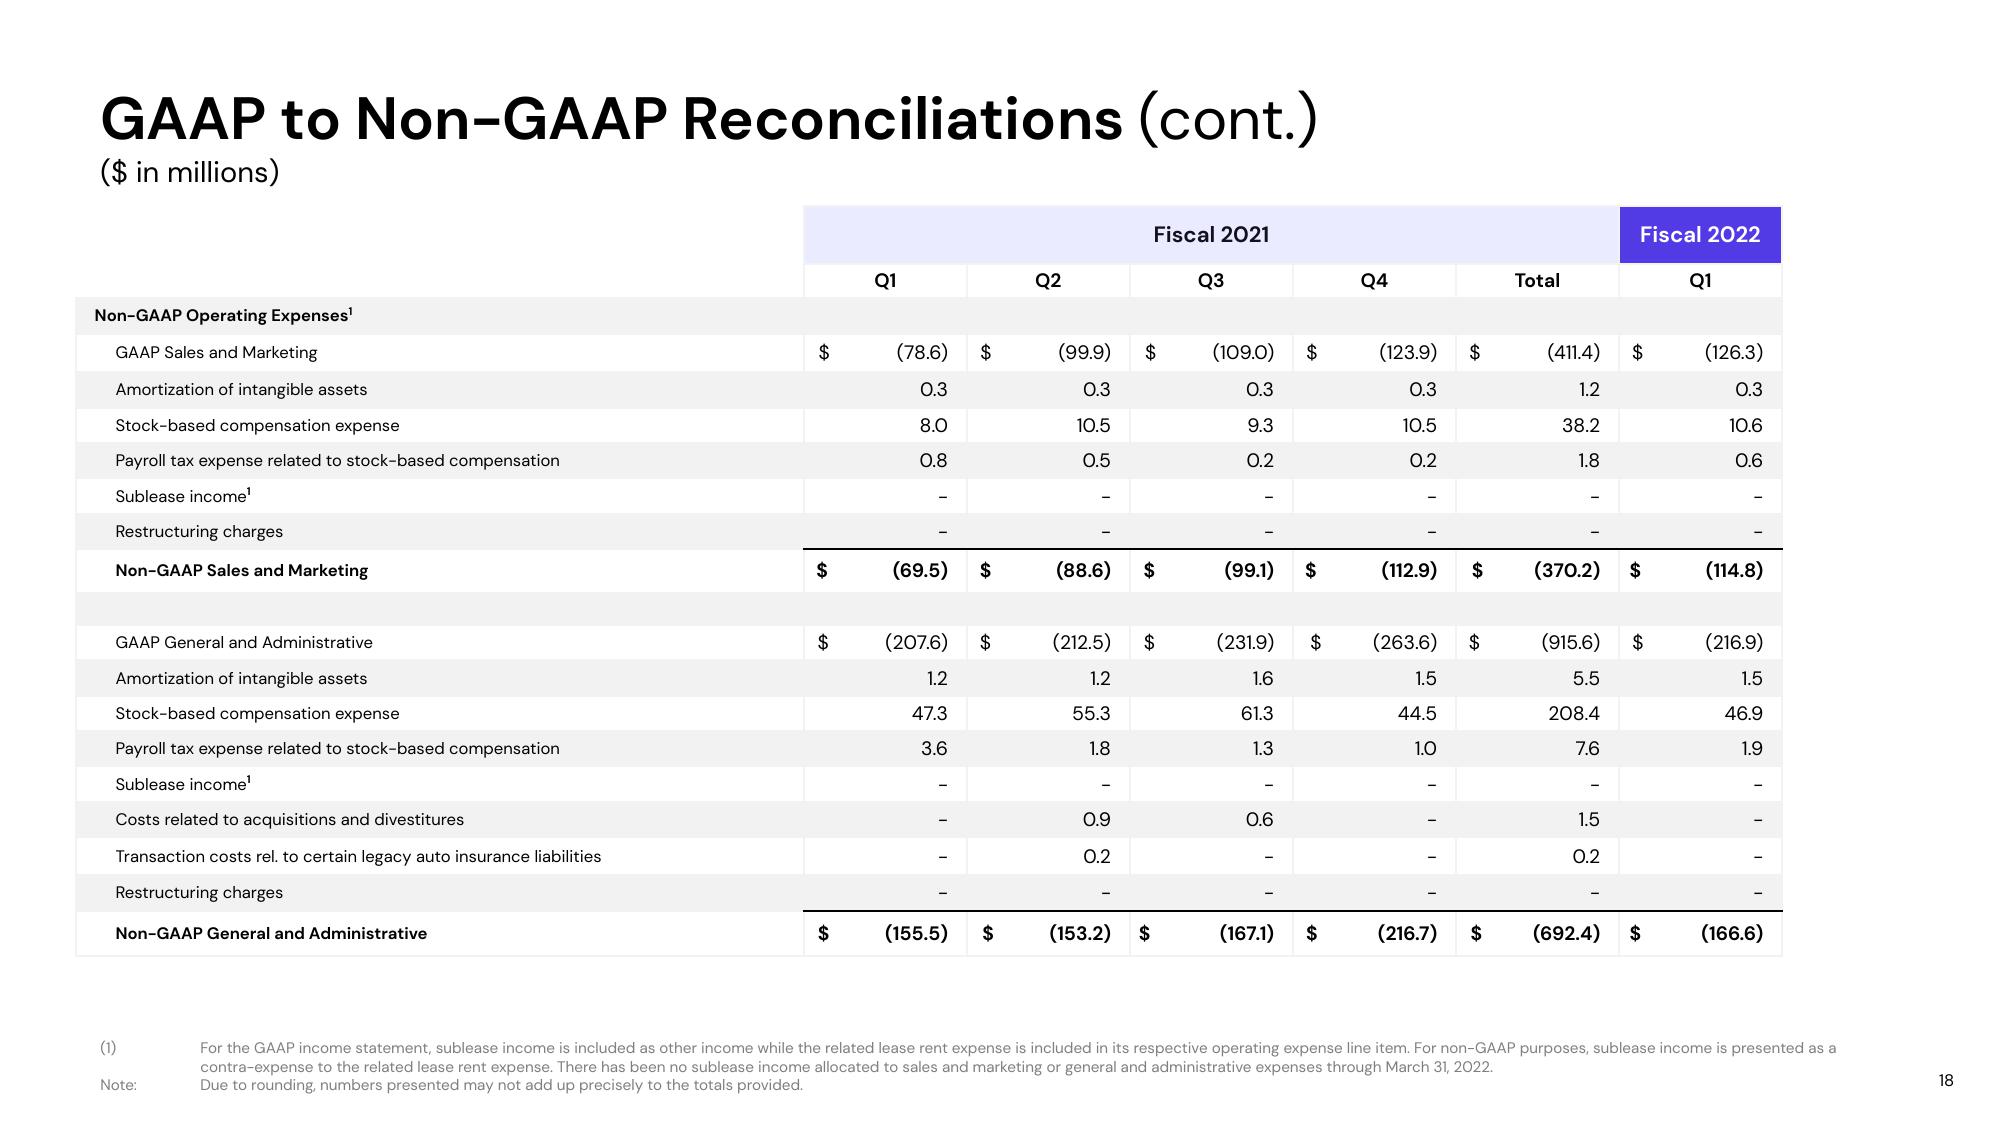
GAAP to Non-GAAP Reconciliations (cont.)
($ in millions)
Non-GAAP Operating Expenses¹
GAAP Sales and Marketing
Amortization of intangible assets
Stock-based compensation expense
Payroll tax expense related to stock-based compensation
Sublease income¹
Restructuring charges
Non-GAAP Sales and Marketing
GAAP General and Administrative
Amortization of intangible assets
Stock-based compensation expense
Payroll tax expense related to stock-based compensation
Sublease income¹
Costs related to acquisitions and divestitures
Transaction costs rel. to certain legacy auto insurance liabilities
Restructuring charges
Non-GAAP General and Administrative
(1)
Note:
$
$
$
$
Q1
(78.6)
0.3
8.0
0.8
(69.5)
(207.6)
1.2
47.3
3.6
$
$
$
(155.5) $
Q2
(99.9) $
0.3
10.5
0.5
(88.6) $
Fiscal 2021
(212.5) $
1.2
55.3
1.8
0.9
0.2
(153.2)
$
Q3
(109.0)
0.3
9.3
0.2
(99.1)
(231.9)
1.6
61.3
1.3
0.6
$
$
$
(167.1) $
Q4
(123.9)
0.3
10.5
0.2
(112.9)
$
(216.7)
$
(263.6) $
1.5
44.5
1.0
$
Total
(411.4)
1.2
38.2
1.8
(370.2)
1.5
0.2
Fiscal 2022
(692.4)
$
(915.6) $
5.5
208.4
7.6
$
$
Q1
(126.3)
0.3
10.6
0.6
(114.8)
(216.9)
1.5
46.9
1.9
(166.6)
For the GAAP income statement, sublease income is included as other income while the related lease rent expense is included in its respective operating expense line item. For non-GAAP purposes, sublease income is presented as a
contra-expense to the related lease rent expense. There has been no sublease income allocated to sales and marketing or general and administrative expenses through March 31, 2022.
Due to rounding, numbers presented may not add up precisely to the totals provided.
18View entire presentation