Maersk Investor Presentation Deck slide image

Maersk Investor Presentation Deck

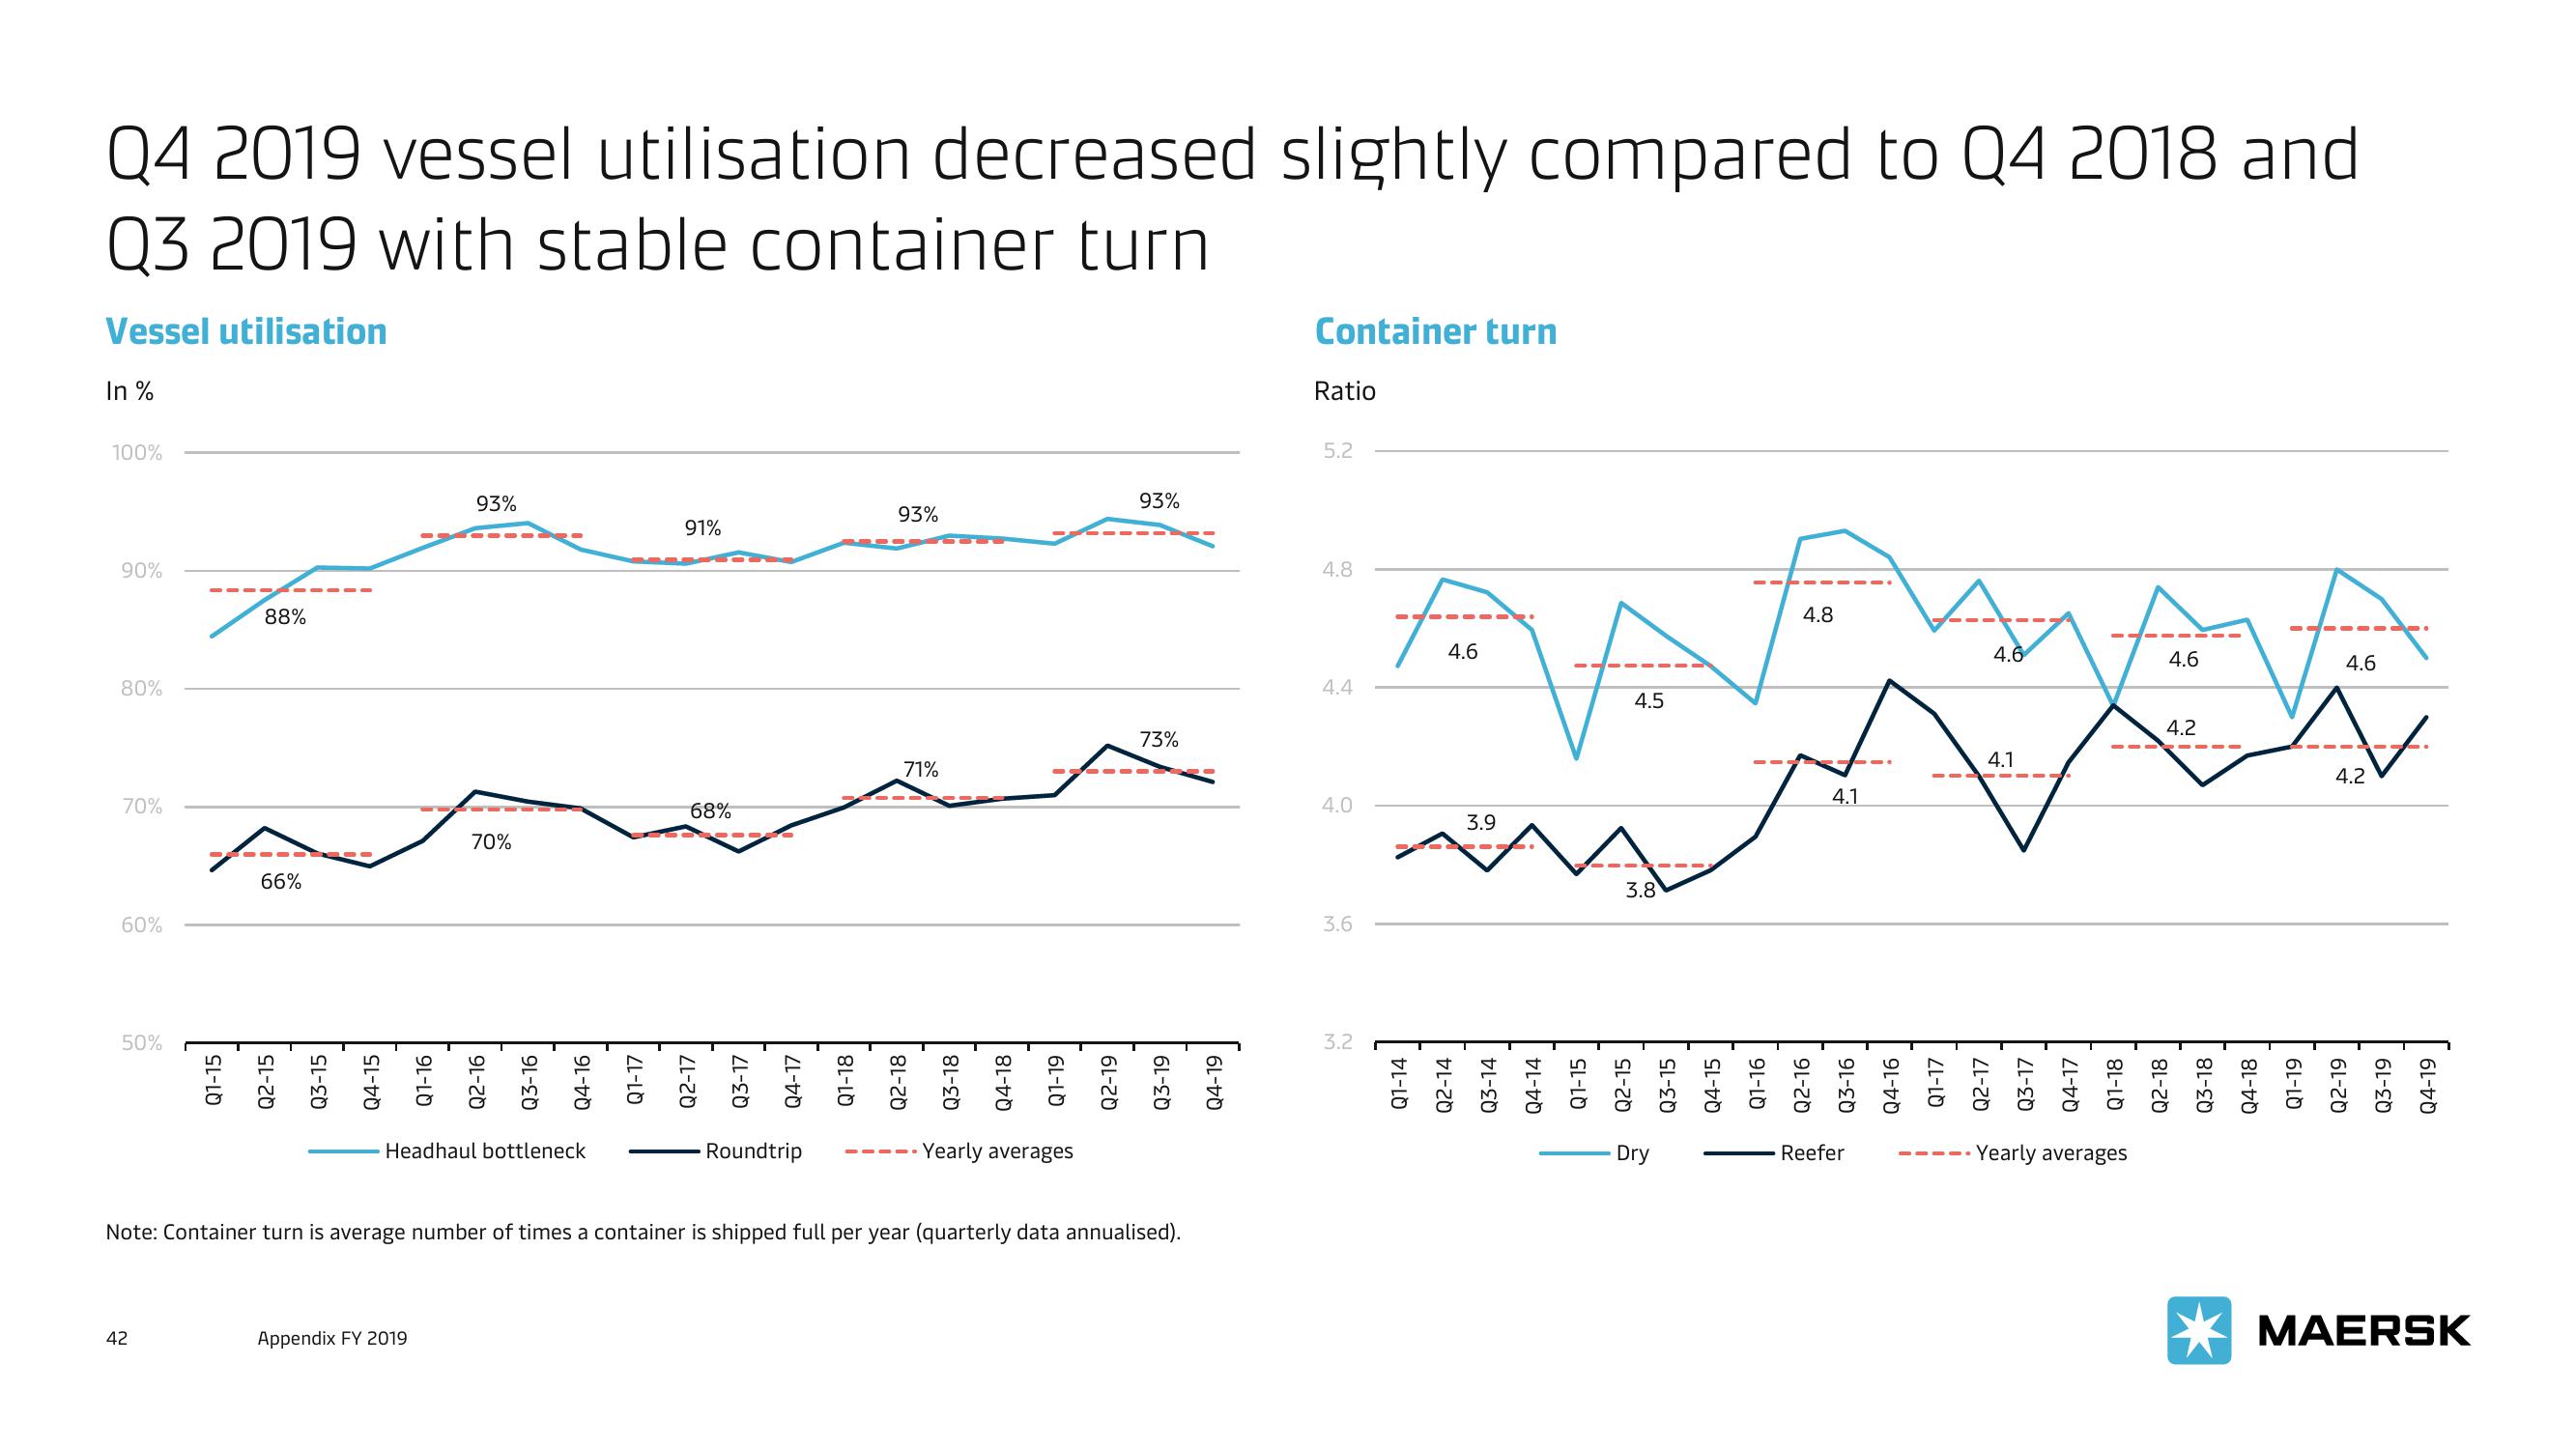
Q4 2019 vessel utilisation decreased slightly compared to Q4 2018 and Q3 2019 with stable container turn Vessel utilisation In % 100% 90% 80% 70% 60% 50% 88% 42 --- 66% Q1-15 Q2-15 93% 70% Headhaul bottleneck Appendix FY 2019 91% 68% Q3-17 Roundtrip 93% 71% Q1-19 Yearly averages Q2-19 93% 73% Note: Container turn is average number of times a container is shipped full per year (quarterly data annualised). 61-20 Q4-19 Container turn Ratio 5.2 4.8 4.4 4.0 3.6 3.2 4.6 3.9 4.5 3.8 4.8 Dry 4.1 4.6 Reefer 4.1 4.6 Yearly averages 4.2 Q1-14 Q2-14 Q3-14 Q4-14 Q1-15 Q2-15 Q3-15 Q4-15 Q1-16 Q2-16 Q3-16 Q4-16 Q1-17 Q2-17 Q3-17 Q4-17 Q1-18 Q2-18 Q3-18 Q4-18 Q1-19 Q2-19 Q3-19 Q4-19 4.6 4.2 MAERSK
View entire presentation