Informatica Investor Presentation Deck
48
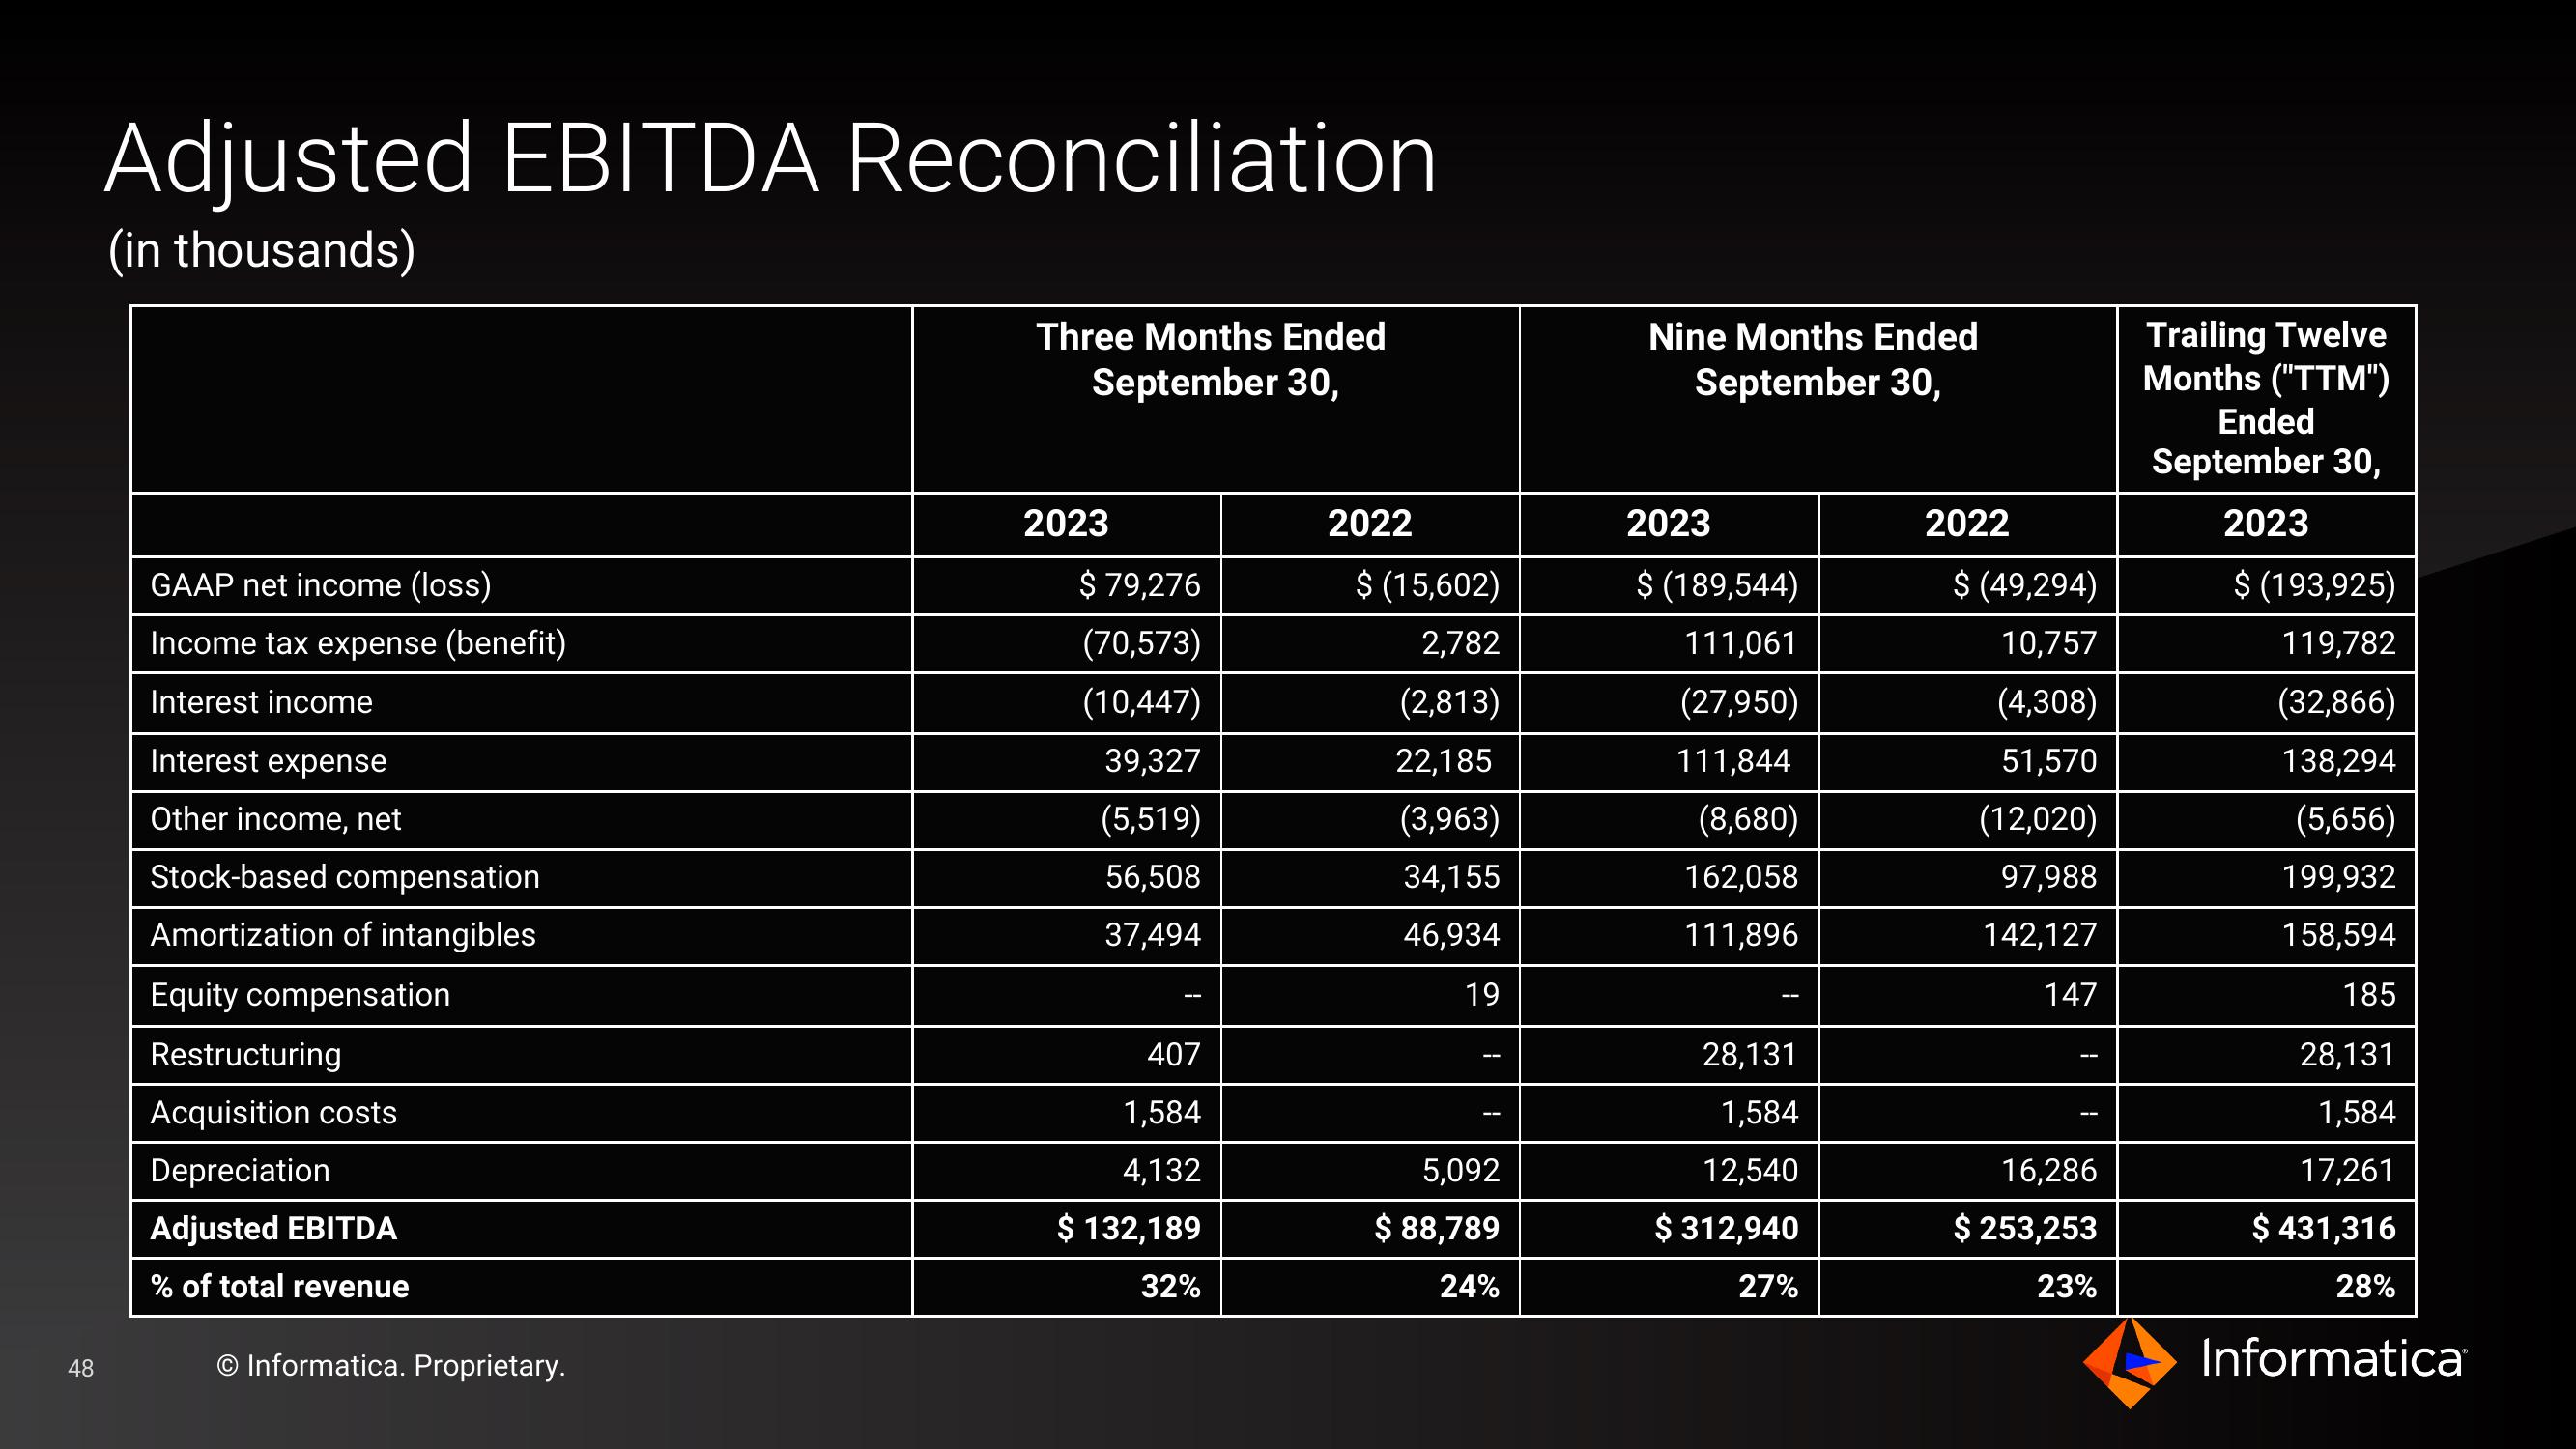
Adjusted EBITDA Reconciliation
(in thousands)
GAAP net income (loss)
Income tax expense (benefit)
Interest income
Interest expense
Other income, net
Stock-based compensation
Amortization of intangibles
Equity compensation
Restructuring
Acquisition costs
Depreciation
Adjusted EBITDA
% of total revenue
O Informatica. Proprietary.
Three Months Ended
September 30,
2023
$ 79,276
(70,573)
(10,447)
39,327
(5,519)
56,508
37,494
--
407
1,584
4,132
$ 132,189
32%
2022
$ (15,602)
2,782
(2,813)
22,185
(3,963)
34,155
46,934
19
5,092
$ 88,789
24%
Nine Months Ended
September 30,
2023
$(189,544)
111,061
(27,950)
111,844
(8,680)
162,058
111,896
28,131
1,584
12,540
$ 312,940
27%
2022
$ (49,294)
10,757
(4,308)
51,570
(12,020)
97,988
142,127
147
--
16,286
$ 253,253
23%
Trailing Twelve
Months ("TTM")
Ended
September 30,
2023
$ (193,925)
119,782
(32,866)
138,294
(5,656)
199,932
158,594
185
28,131
1,584
17,261
$ 431,316
28%
InformaticaView entire presentation