Aeva Investor Presentation Deck
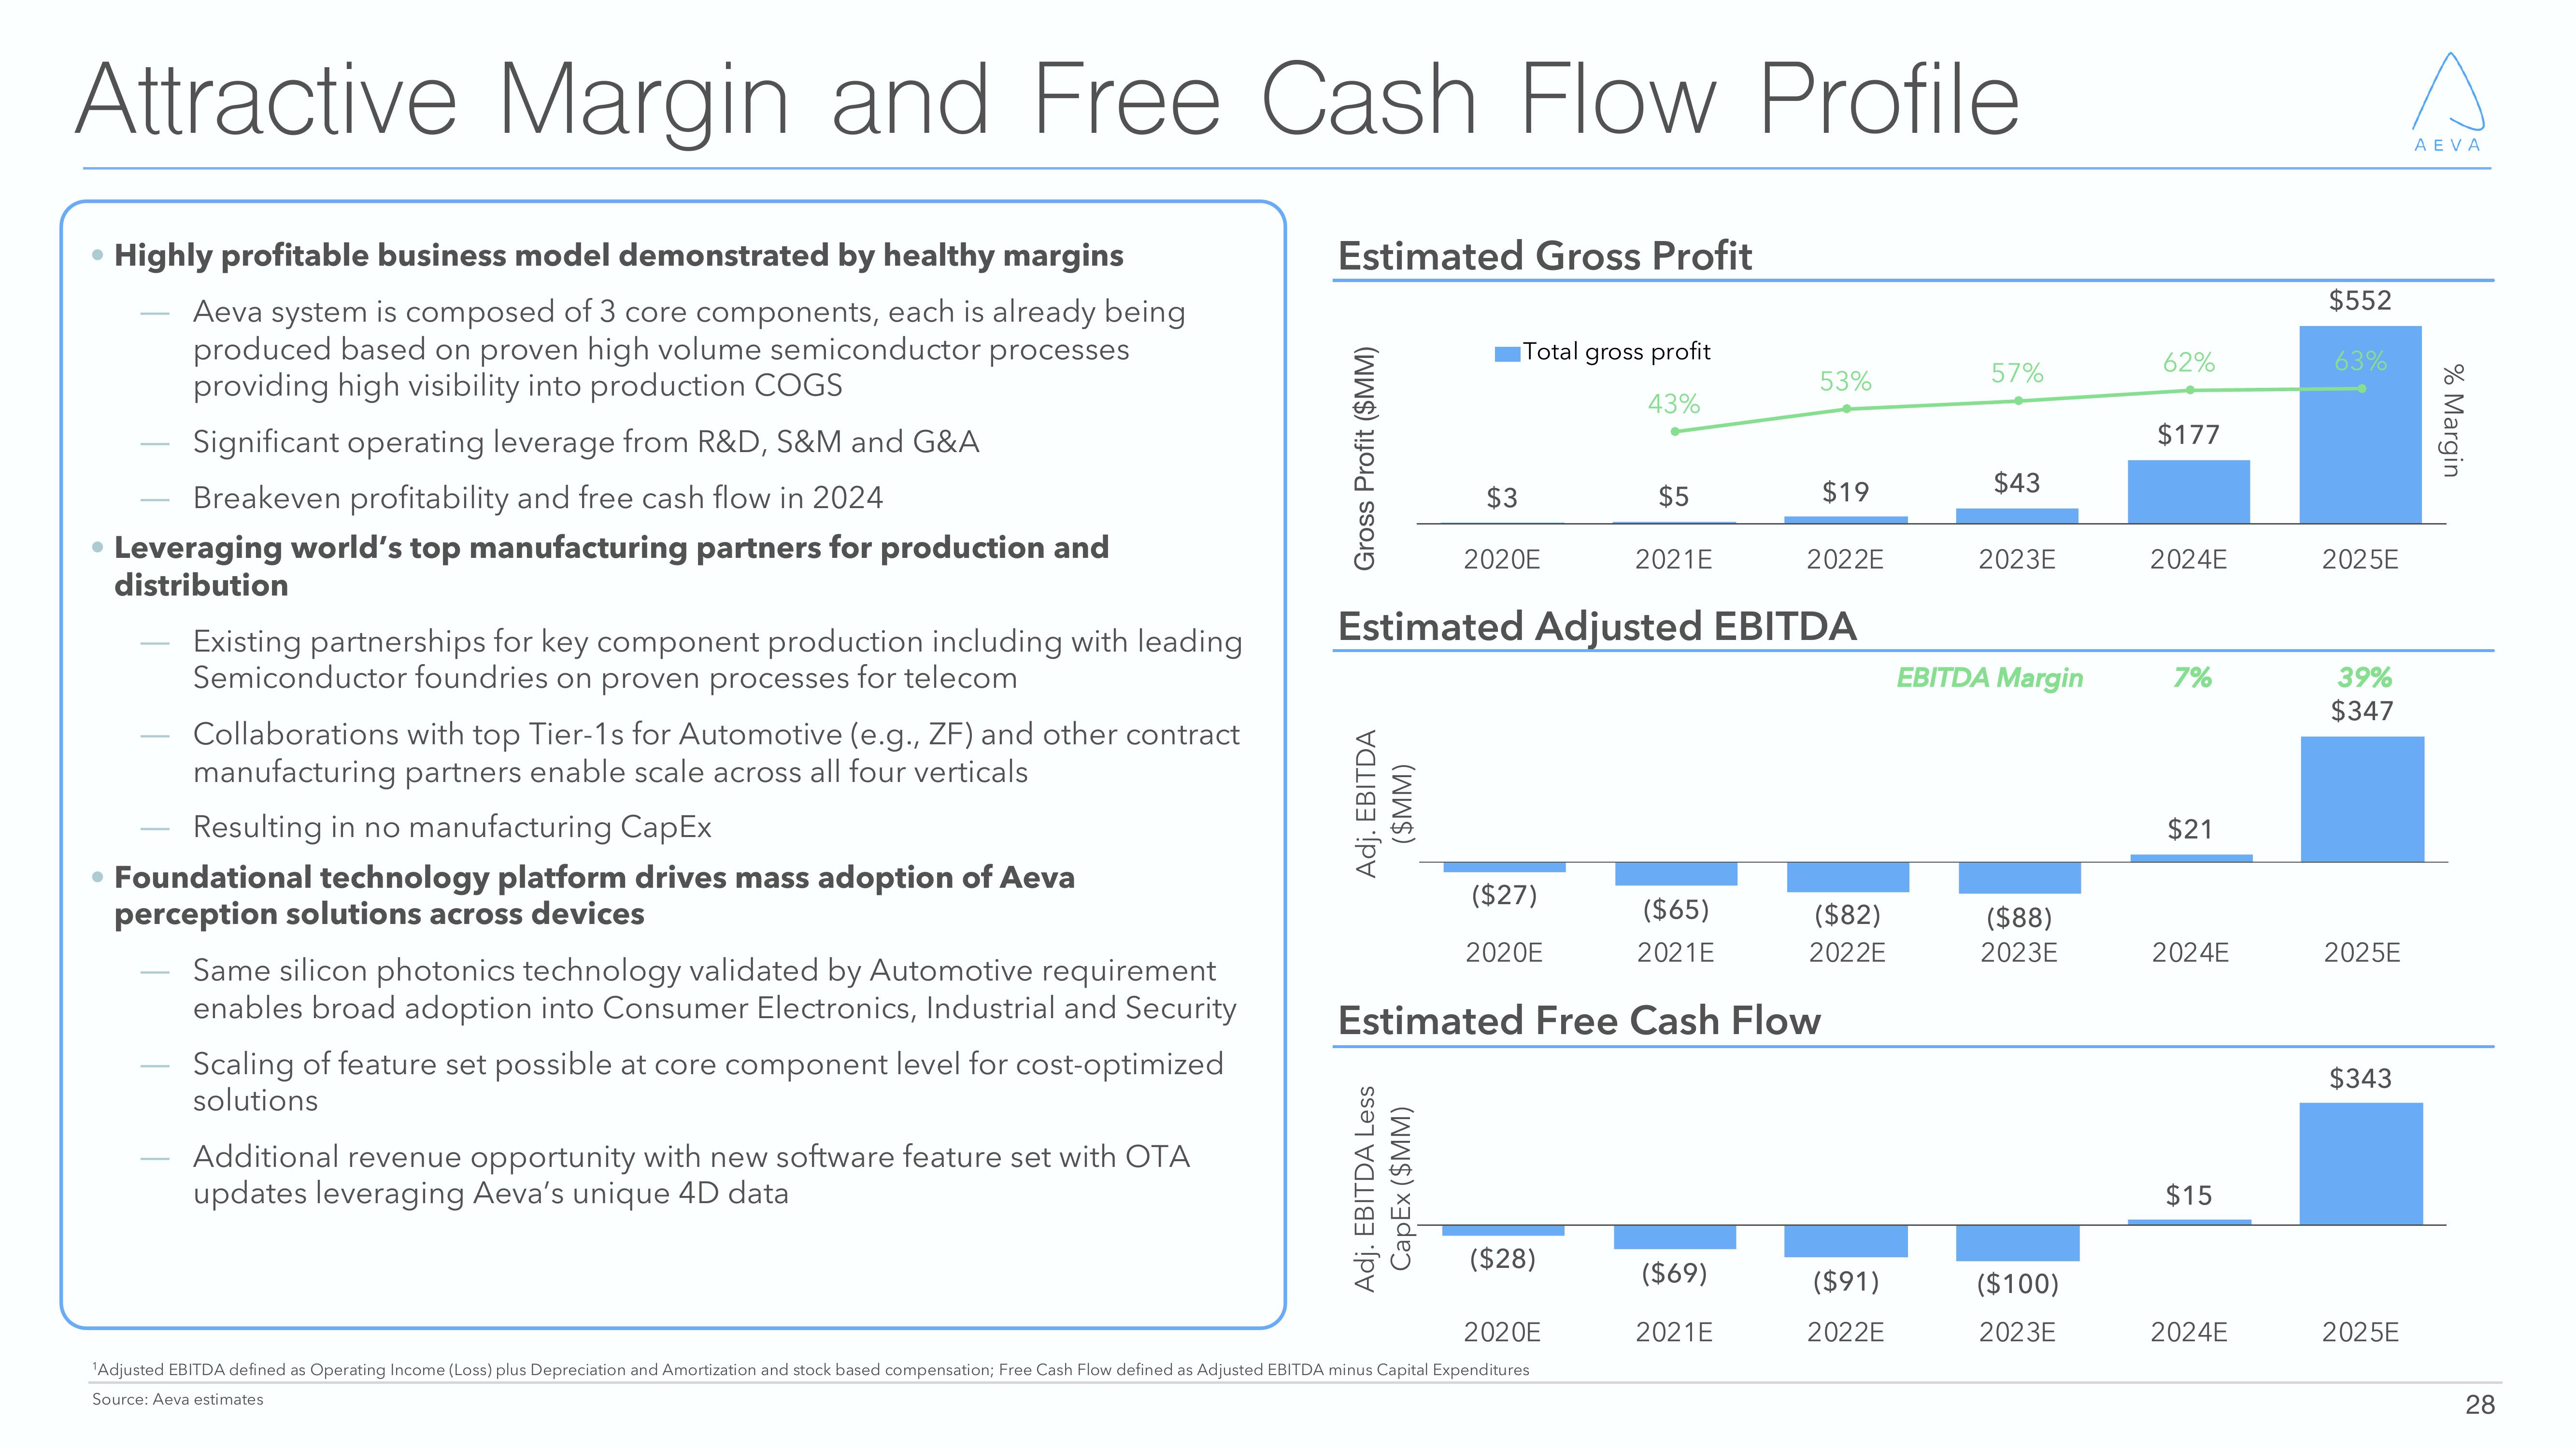
Attractive Margin and Free Cash Flow Profile
Highly profitable business model demonstrated by healthy margins
Aeva system is composed of 3 core components, each is already being
produced based on proven high volume semiconductor processes
providing high visibility into production COGS
Significant operating leverage from R&D, S&M and G&A
Breakeven profitability and free cash flow in 2024
●
• Leveraging world's top manufacturing partners for production and
distribution
●
Existing partnerships for key component production including with leading
Semiconductor foundries on proven processes for telecom
Collaborations with top Tier-1s for Automotive (e.g., ZF) and other contract
manufacturing partners enable scale across all four verticals
Resulting in no manufacturing CapEx
• Foundational technology platform drives mass adoption of Aeva
perception solutions across devices
Same silicon photonics technology validated by Automotive requirement
enables broad adoption into Consumer Electronics, Industrial and Security
Scaling of feature set possible at core component level for cost-optimized
solutions
Additional revenue opportunity with new software feature set with OTA
updates leveraging Aeva's unique 4D data
Estimated Gross Profit
Gross Profit ($MM)
Adj. EBITDA
($MM)
$3
Total gross profit
43%
Adj. EBITDA Less
CapEx ($MM)
2020E
($27)
2020E
$5
Estimated Adjusted EBITDA
($28)
2021E
2020E
¹Adjusted EBITDA defined as Operating Income (Loss) plus Depreciation and Amortization and stock based compensation; Free Cash Flow defined as Adjusted EBITDA minus Capital Expenditures
Source: Aeva estimates
($65)
2021E
Estimated Free Cash Flow
53%
($69)
2021E
$19
2022E
($82)
2022E
($91)
2022E
57%
$43
2023E
EBITDA Margin
($88)
2023E
($100)
2023E
62%
$177
2024E
7%
$21
2024E
$15
2024E
$552
63%
2025E
39%
$347
2025E
$343
2025E
AEVA
% Margin
28View entire presentation