Nogin SPAC Presentation Deck
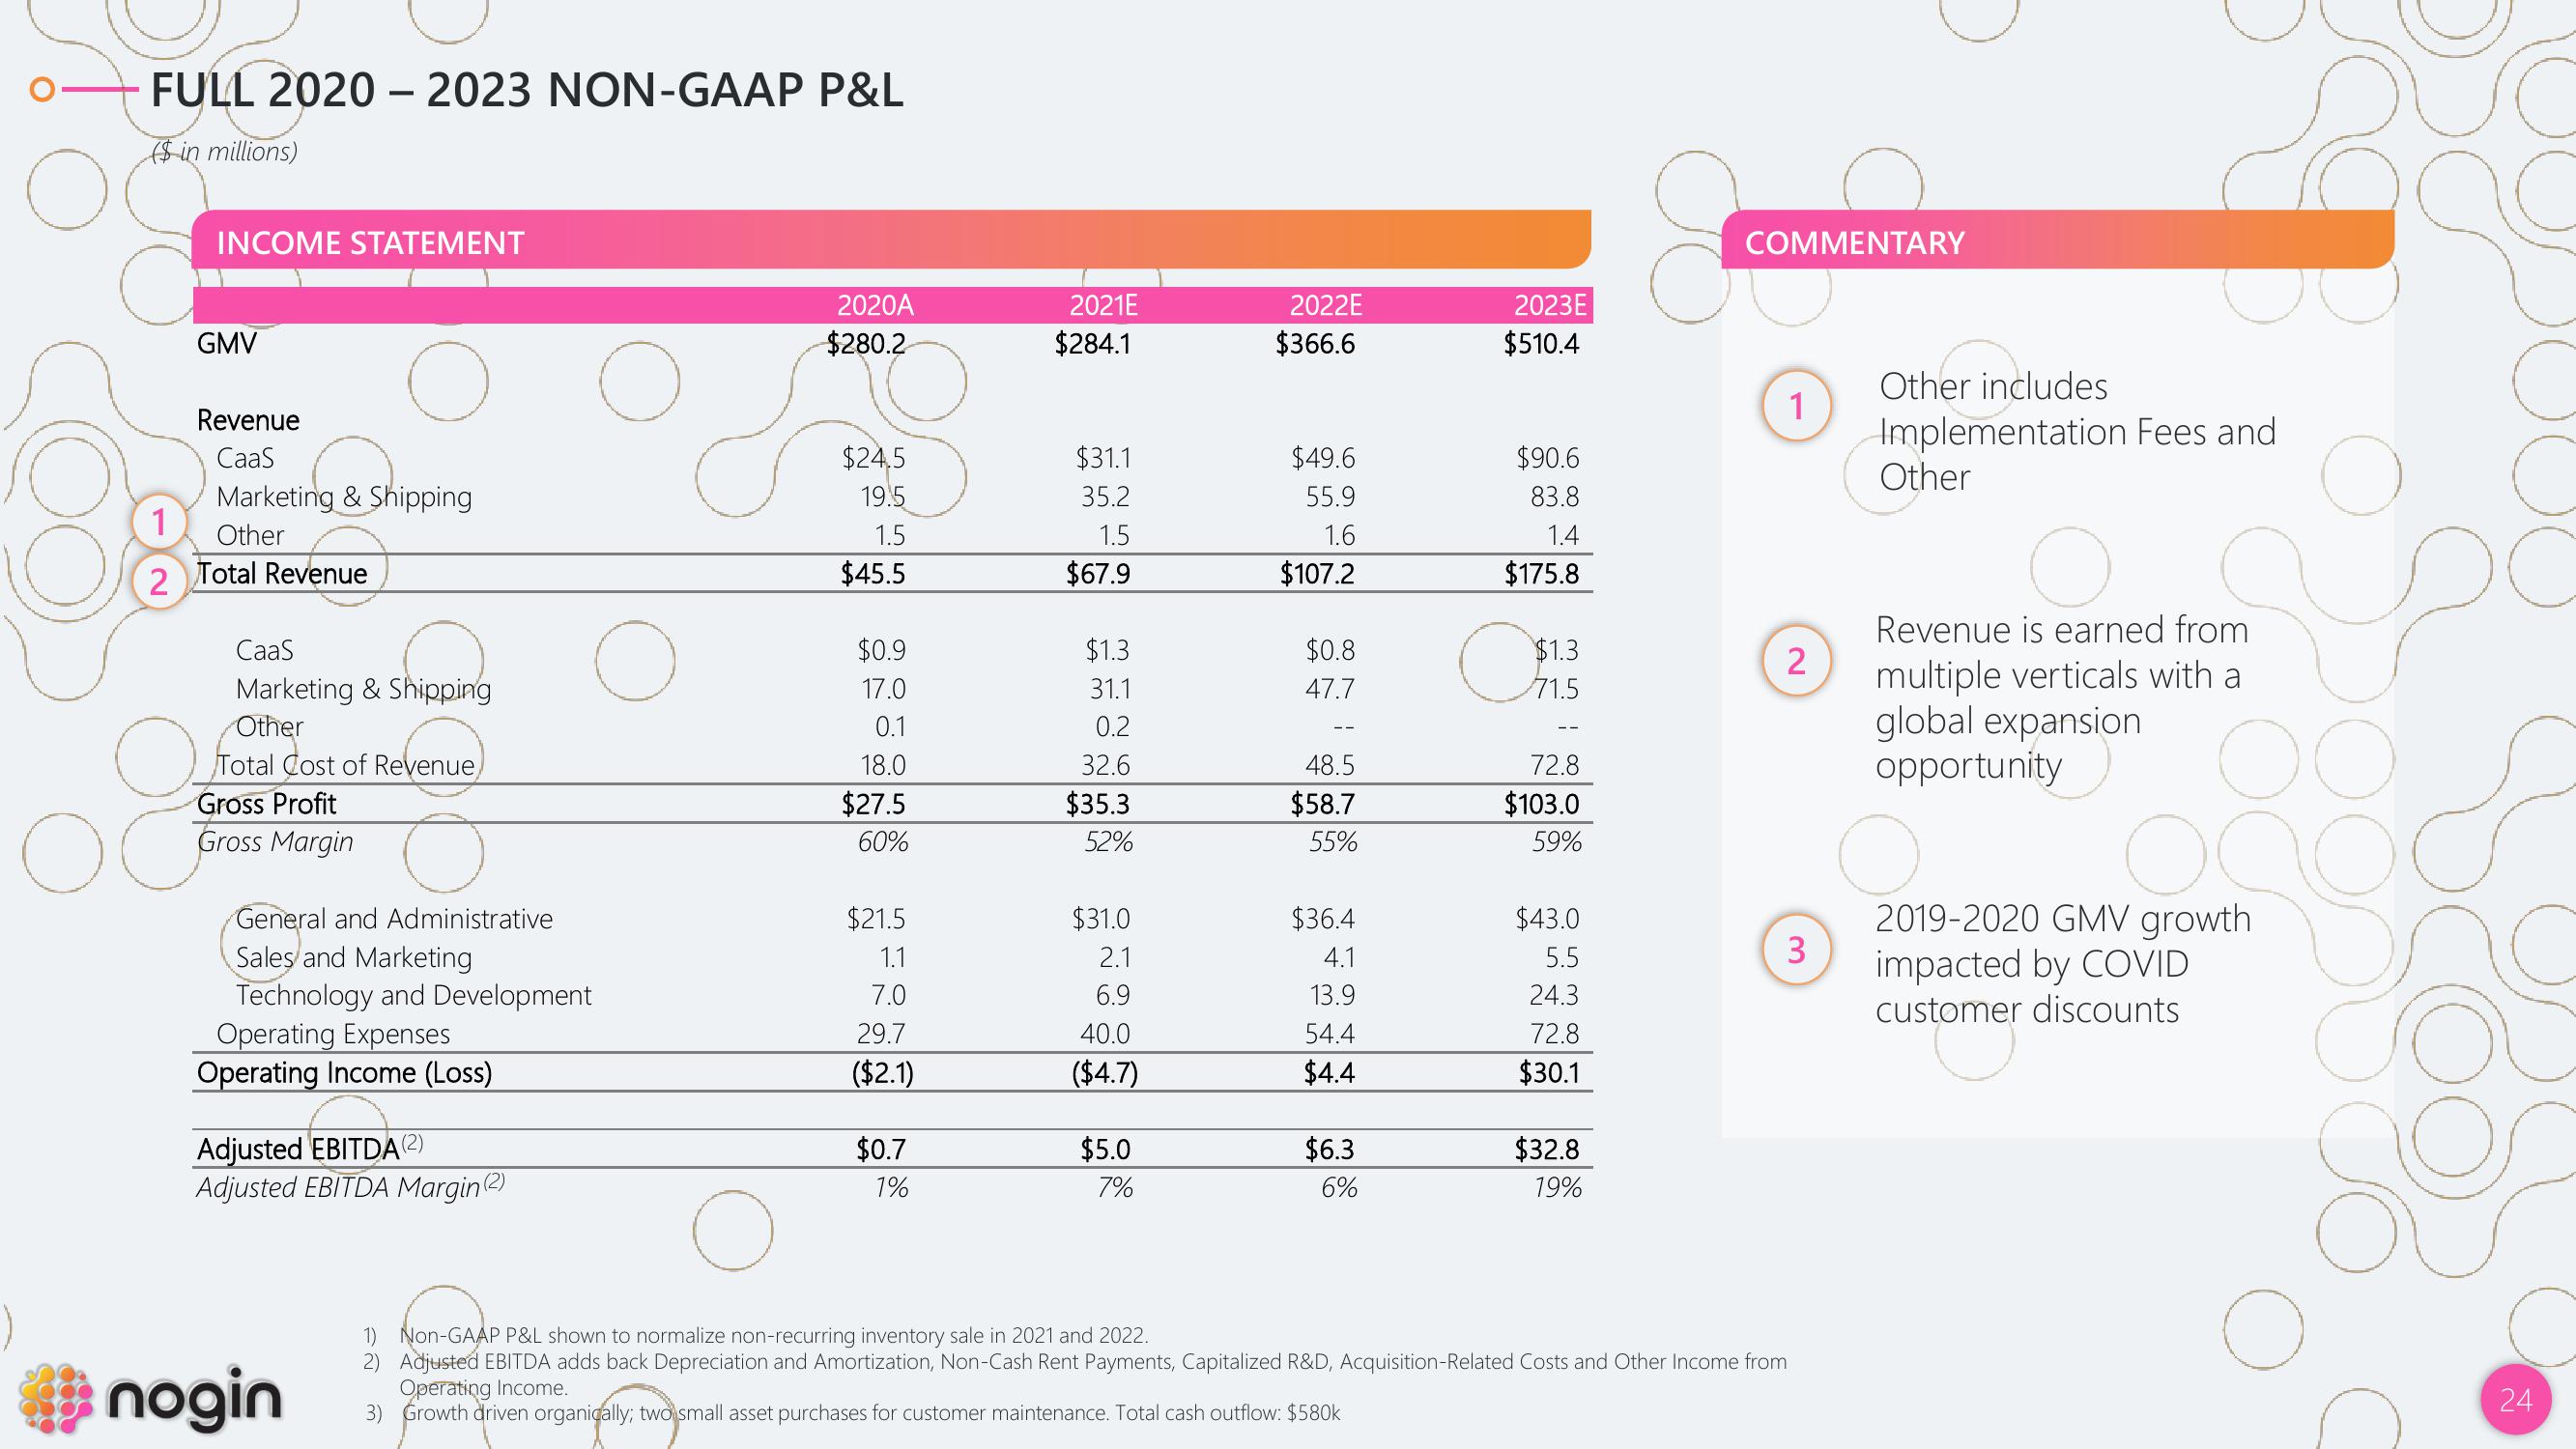
FULL 2020-2023 NON-GAAP P&L
($ in millions)
INCOME STATEMENT
GMV
Revenue
CaaS
O
OG
Marketing & Shipping
1
Other
2 Total Revenue
O
CaaS
Marketing & Shipping
Other
Total Cost of Revenue
Gross Profit
Gross Marge
General and Administrative
Sales and Marketing
Technology and Development
Operating Expenses
Operating Income (Loss)
Adjusted EBITDA (²)
Adjusted EBITDA Margin(2)
nogin
O
2020A
$280.2
$24.5
19.5
1.5
$45.5
$0.9
17.0
0.1
18.0
$27.5
60%
$21.5
1.1
7.0
29.7
($2.1)
$0.7
1%
2021E
$284.1
$31.1
35.2
1.5
$67.9
$1.3
31.1
0.2
32.6
$35.3
52%
$31.0
2.1
6.9
40.0
($4.7)
$5.0
7%
2022E
$366.6
$49.6
55.9
1.6
$107.2
$0.8
47.7
48.5
$58.7
55%
$36.4
4.1
13.9
54.4
$4.4
$6.3
6%
2023E
$510.4
$90.6
83.8
1.4
$175.8
O
$1.3
71.5
72.8
$103.0
59%
$43.0
5.5
24.3
72.8
$30.1
$32.8
19%
COMMENTARY
1
2
1) Non-GAAP P&L shown to normalize non-recurring inventory sale in 2021 and 2022.
2) Adjusted EBITDA adds back Depreciation and Amortization, Non-Cash Rent Payments, Capitalized R&D, Acquisition-Related Costs and Other Income from
Operating Income.
3) Growth driven organically; two small asset purchases for customer maintenance. Total cash outflow: $580k
3
Other includes
Implementation Fees and
Other
Revenue is earned from
multiple verticals with a
global expansion
opportunity OO
O
2019-2020 GMV growth
impacted by COVID
customer discounts
O
24
NView entire presentation