Cyxtera Results Presentation Deck
2Q YTD 2021 Results
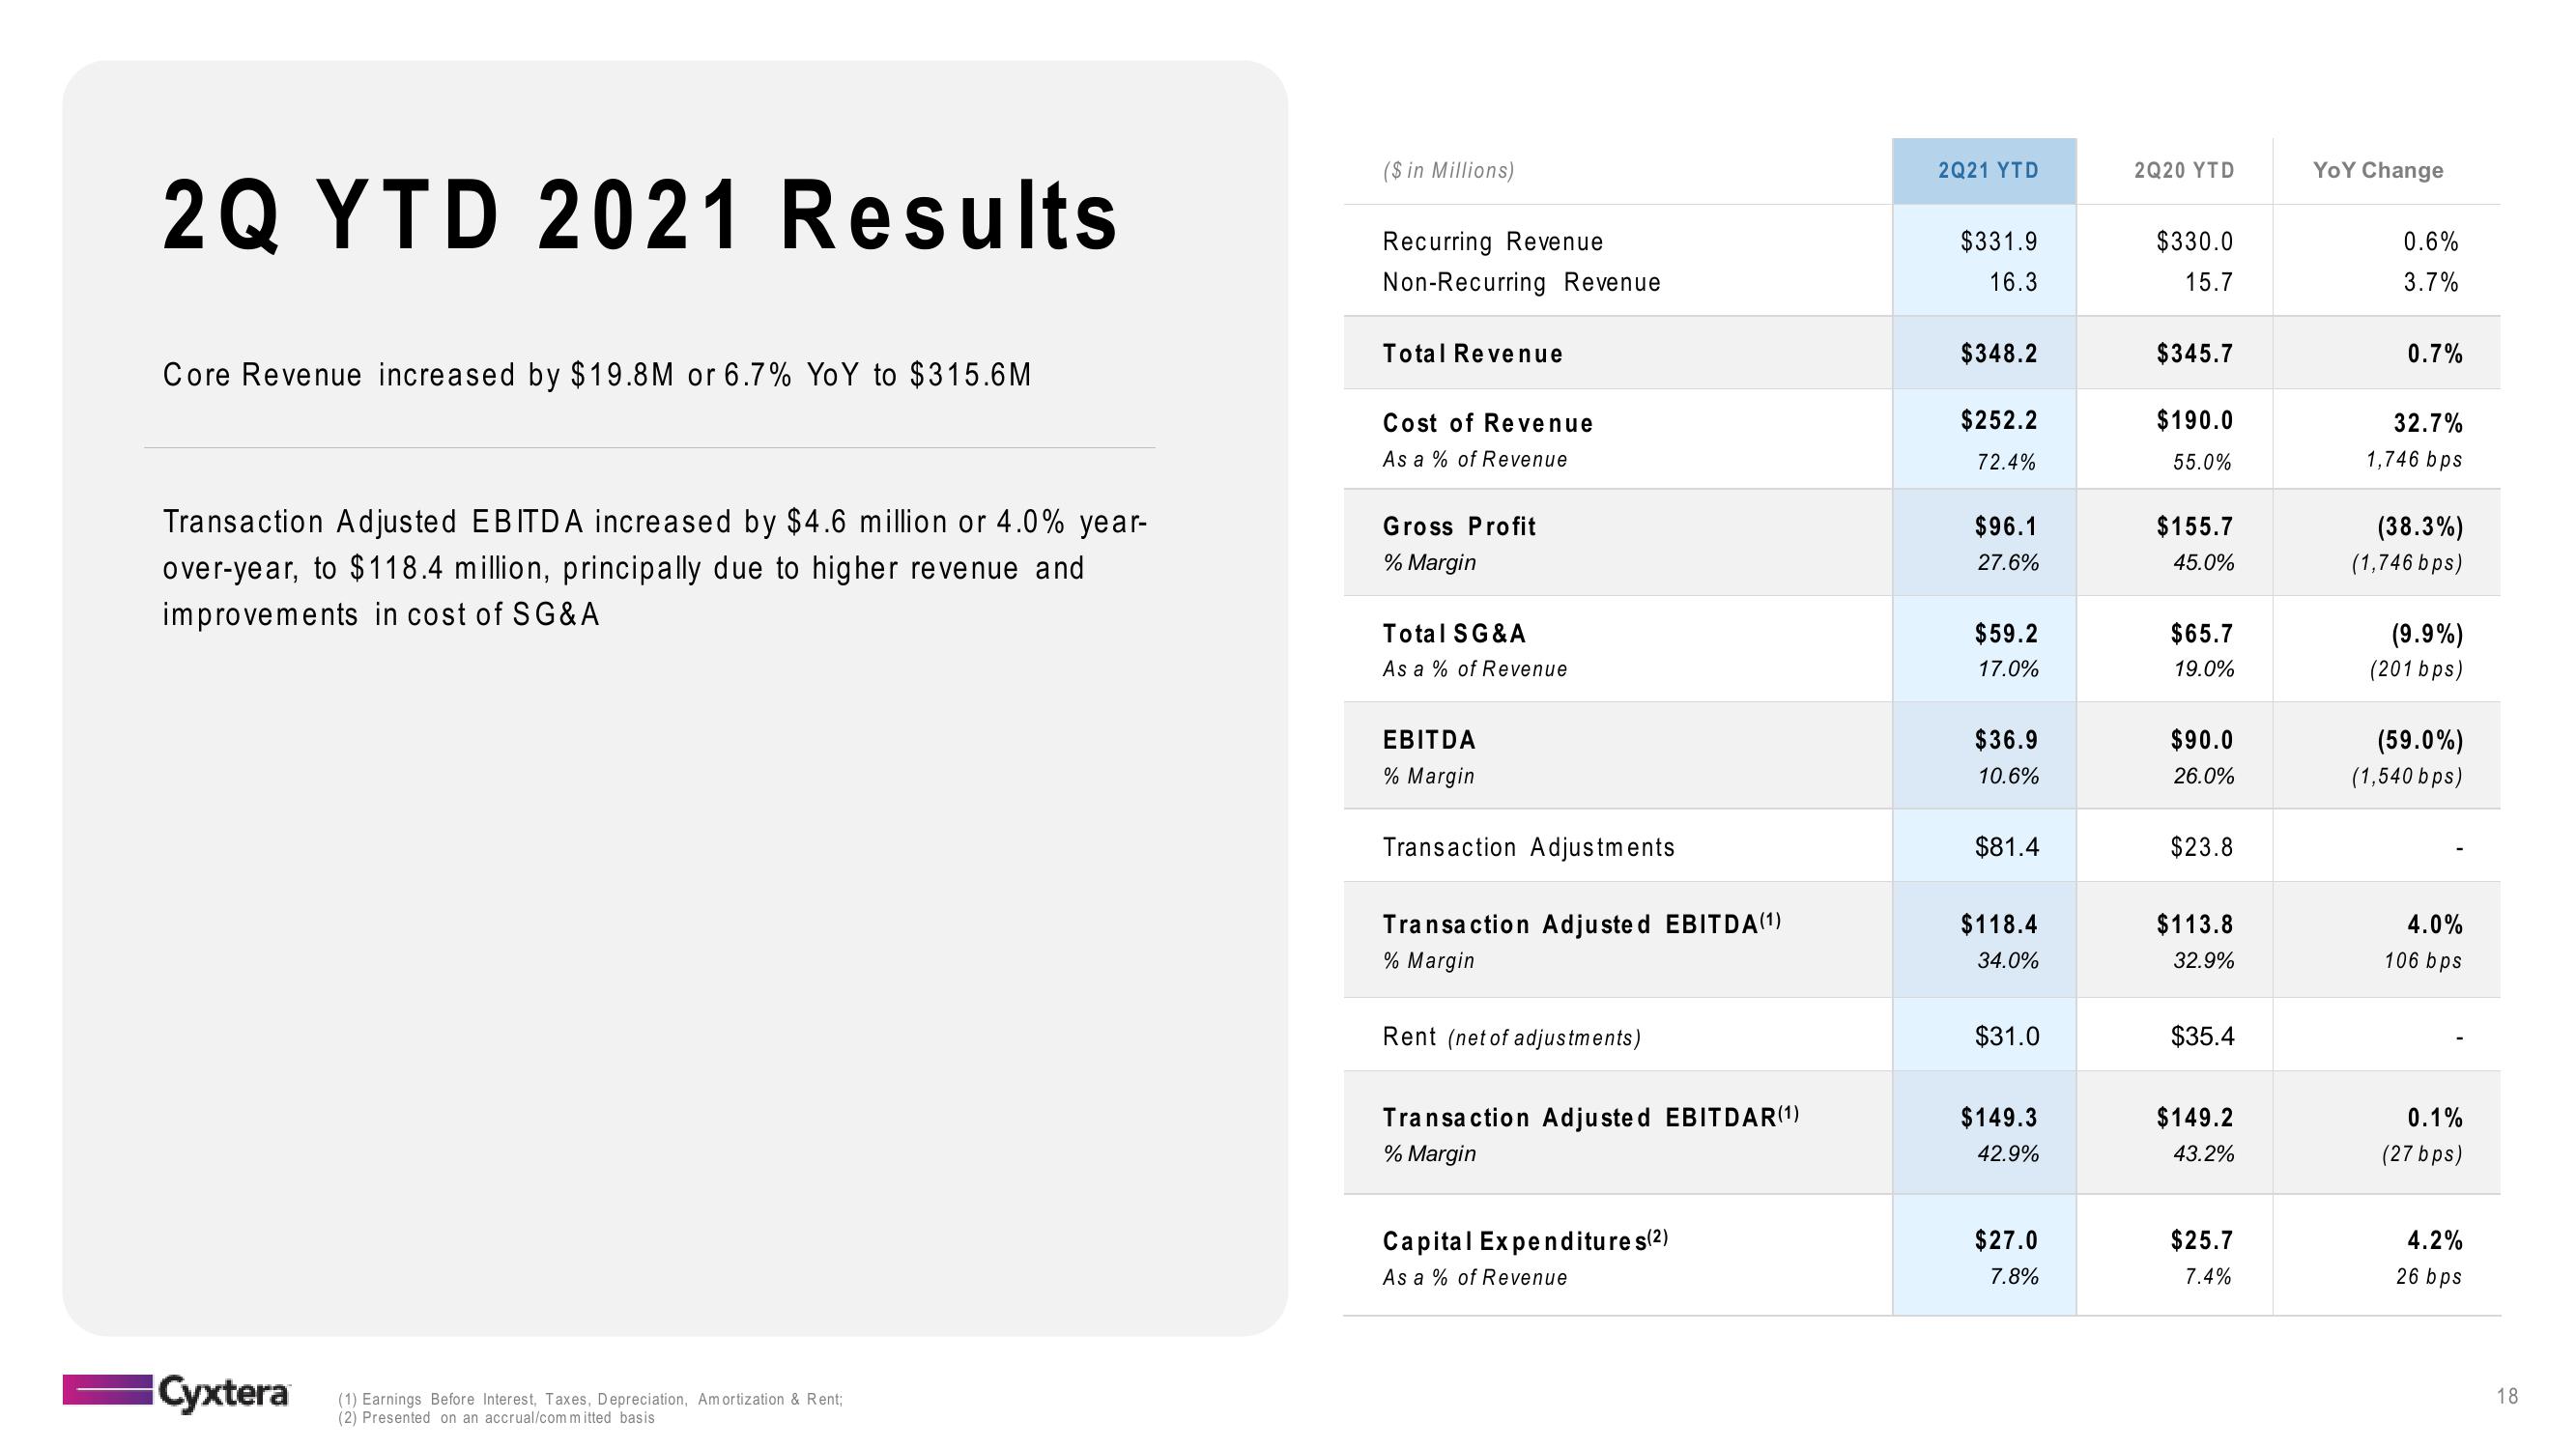
Core Revenue increased by $19.8M or 6.7% YoY to $315.6M
Transaction Adjusted EBITDA increased by $4.6 million or 4.0% year-
over-year, to $118.4 million, principally due to higher revenue and
improvements in cost of SG&A
Cyxtera
(1) Earnings Before Interest, Taxes, Depreciation, Amortization & Rent;
(2) Presented on an accrual/committed basis
($ in Millions)
Recurring Revenue
Non-Recurring Revenue
Total Revenue
Cost of Revenue
As a % of Revenue
Gross Profit
% Margin
Total SG&A
As a % of Revenue
EBITDA
% Margin
Transaction Adjustments
Transaction Adjusted EBITDA (1)
% Margin
Rent (net of adjustments)
Transaction Adjusted EBITDAR(1)
% Margin
Capital Expenditures (²)
As a % of Revenue
2Q21 YTD
$331.9
16.3
$348.2
$252.2
72.4%
$96.1
27.6%
$59.2
17.0%
$36.9
10.6%
$81.4
$118.4
34.0%
$31.0
$149.3
42.9%
$27.0
7.8%
2Q20 YTD
$330.0
15.7
$345.7
$190.0
55.0%
$155.7
45.0%
$65.7
19.0%
$90.0
26.0%
$23.8
$113.8
32.9%
$35.4
$149.2
43.2%
$25.7
7.4%
YOY Change
0.6%
3.7%
0.7%
32.7%
1,746 bps
(38.3%)
(1,746 bps)
(9.9%)
(201 bps)
(59.0%)
(1,540 bps)
4.0%
106 bps
0.1%
(27 bps)
4.2%
26 bps
18View entire presentation