FGI Industries Investor Presentation Deck
Quarterly Business Line Results
Revenue by product category
$25.5
Sanitaryware
($MM)
$20.7
3Q22 3Q23
$104.5$104.8
$75.2
2021 2022 LTM
3Q23
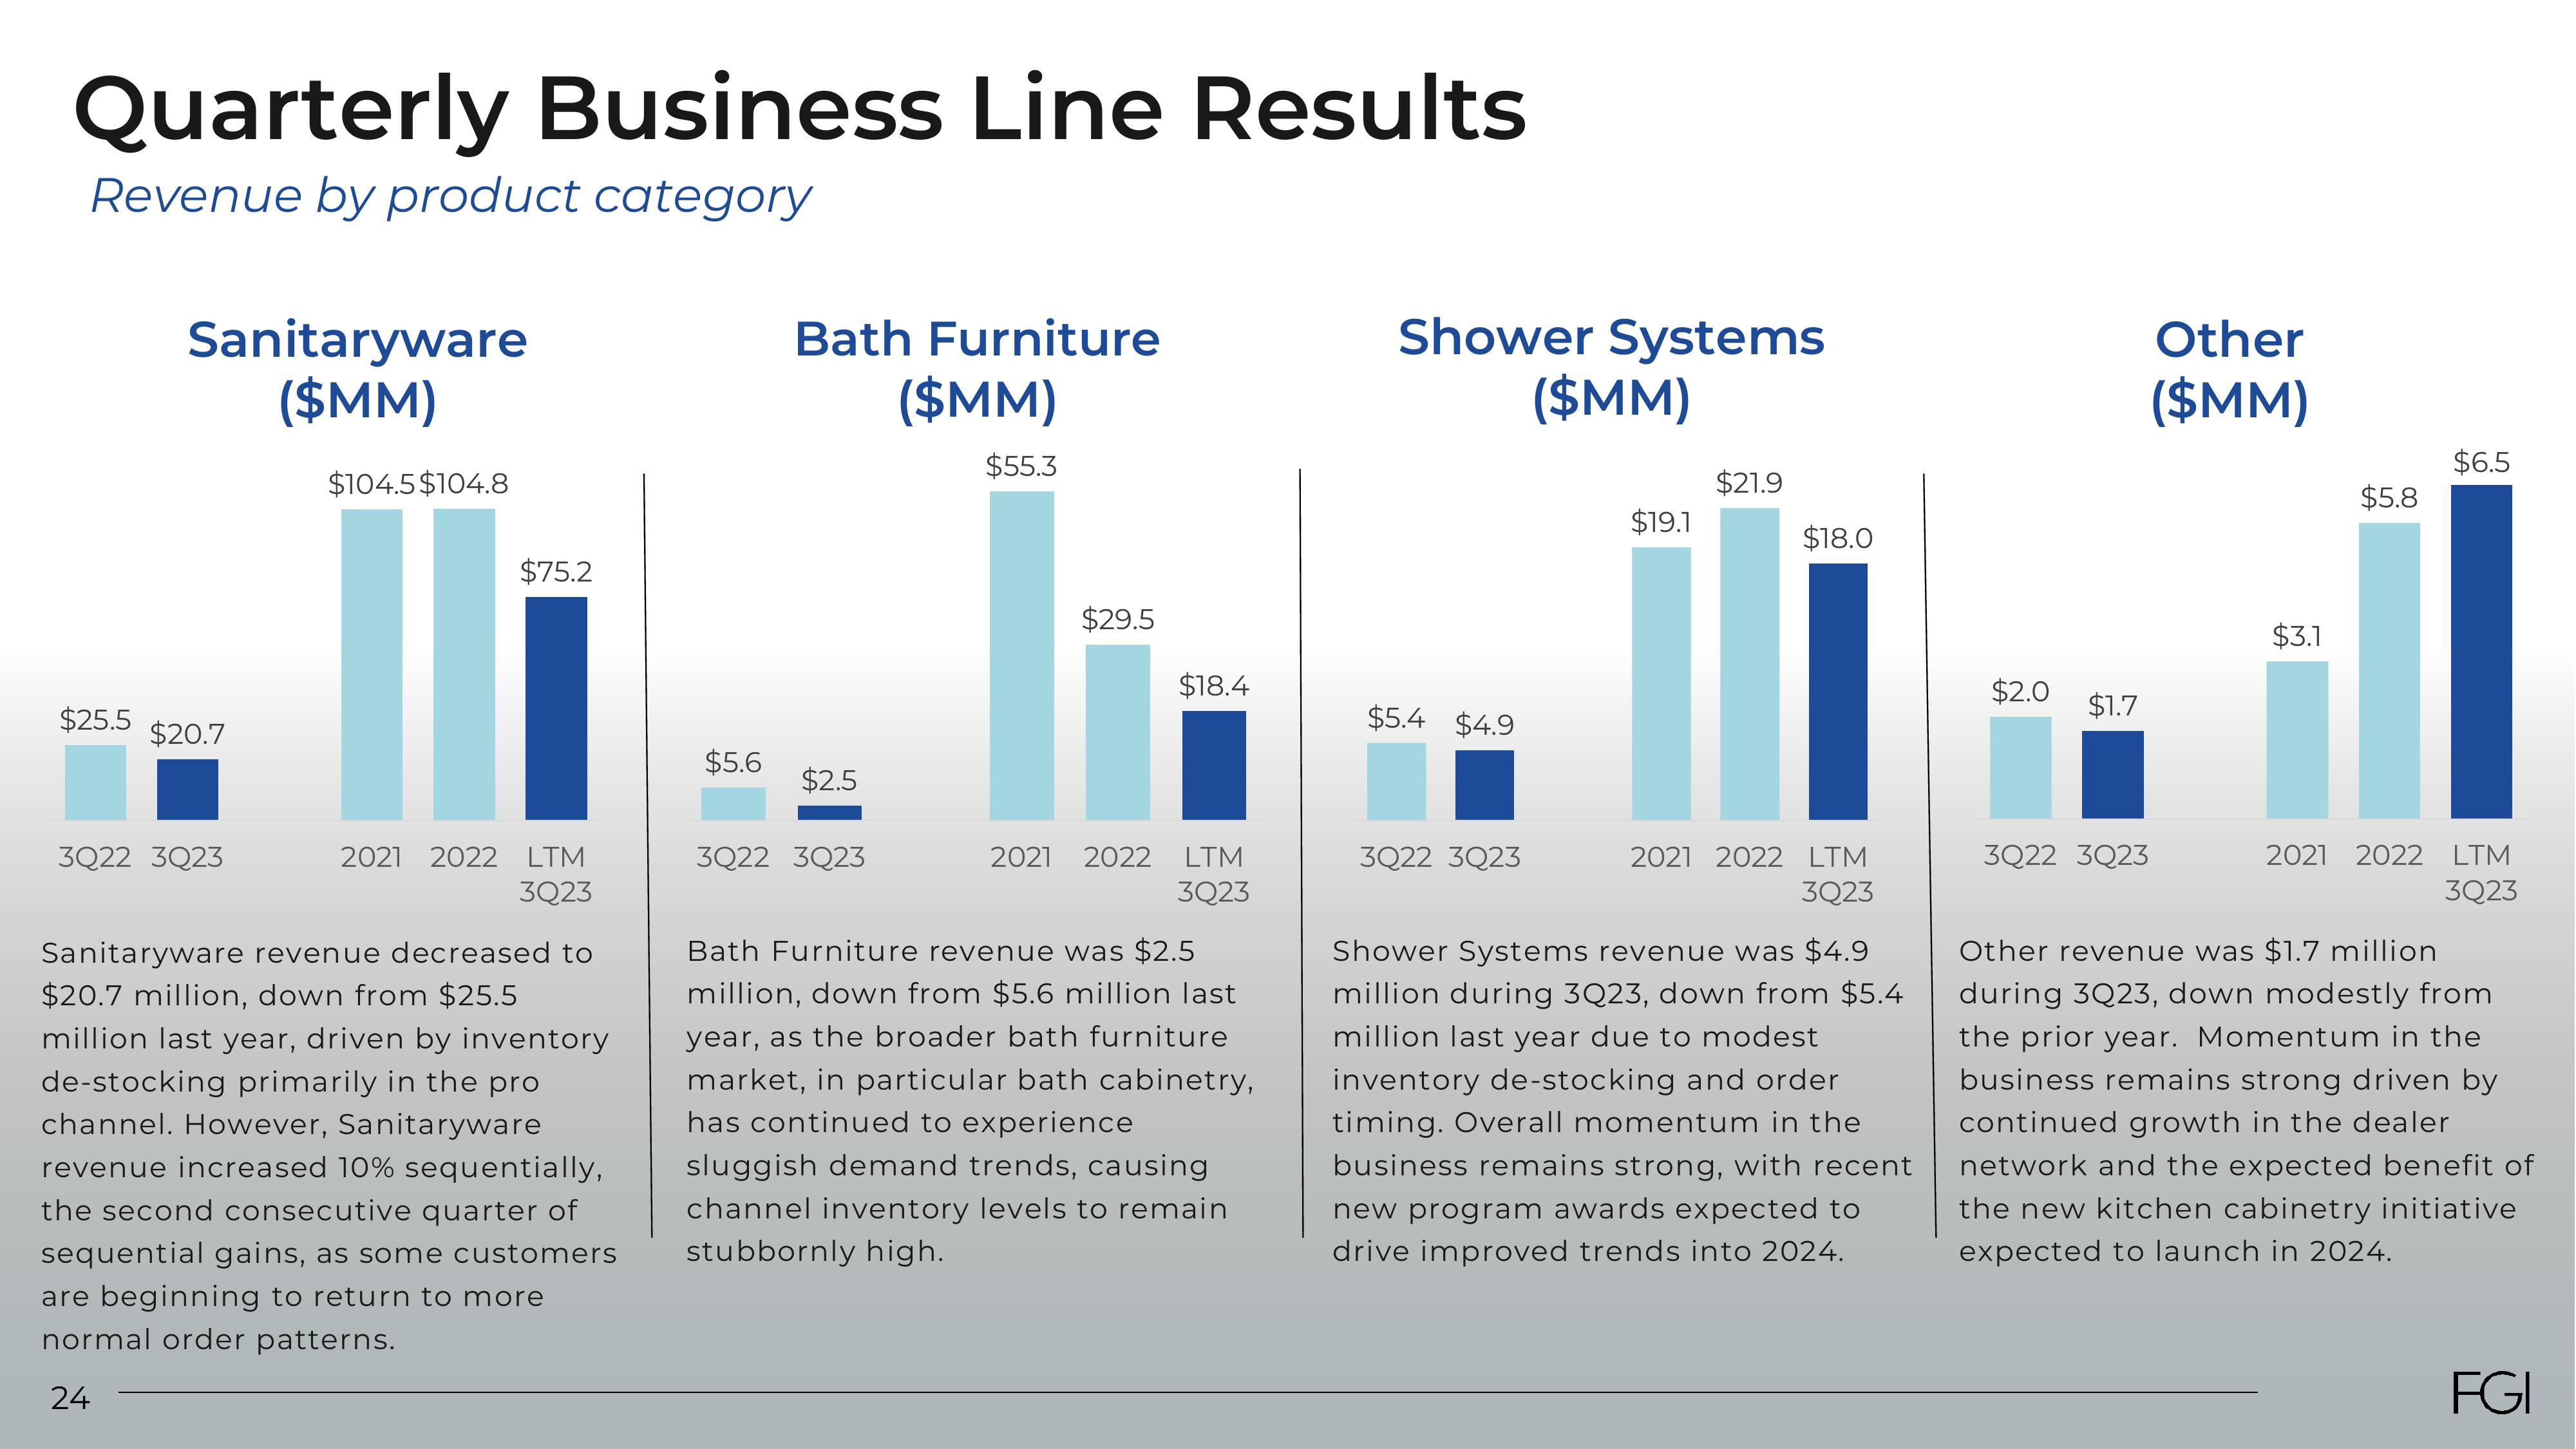
Sanitaryware revenue decreased to
$20.7 million, down from $25.5
million last year, driven by inventory
de-stocking primarily in the pro
channel. How ever, Sar
yware
revenue increased 10% sequentially,
the second consecutive quarter of
sequential gains, as some customers
are beginning to return to more
normal order patterns.
24
$5.6
Bath Furniture
($MM)
$55.3
$2.5
3Q22 3Q23
$29.5
$18.4
2021 2022 LTM
3Q23
Bath Furniture revenue was $2.5
million, down from $5.6 million last
year, as the broader bath furniture
market, in particular bath cabinetry,
has continued to experience
sluggish demand trends, causing
channel inventory levels to remain
stubbornly high.
Shower Systems
($MM)
$5.4 $4.9
3Q22 3Q23
$19.1
$21.9
$18.0
2021 2022 LTM
3Q23
Shower Systems revenue was $4.9
million during 3Q23, down from $5.4
million last year due to modest
inventory de-stocking and order
timing. Overall momentum in the
business remains strong, with recent
new program awards expected to
drive improved trends into 2024.
$2.0
$1.7
3Q22 3Q23
Other
($MM)
$3.1
$5.8
$6.5
2021 2022 LTM
3Q23
Other revenue was $1.7 million
during 3Q23, down modestly from
the prior year. Momentum in the
business remains strong driven by
continued growth in the dealer
network and the expected benefit of
the new kitchen cabinetry initiative
expected to launch in 2024.
FGIView entire presentation