Deutsche Bank Results Presentation Deck
Asset Management
In € m, unless stated otherwise
Financial results
Statement of income
Revenues
Revenues ex-specific items¹
Provision for credit losses
Noninterest expenses
Adjusted costs
Pre-provision profit
Profit (loss) before tax
Balance sheet and resources
Assets under management, in € bn²
Net flows, in € bn
Leverage exposure, in € bn
Risk-weighted assets, in € bn
Performance measures and ratios
Management fee margin, in bps
Cost/income ratio
ROTE³
Q3 2023
Notes: for footnotes refer to slides 44 and 45
Deutsche Bank
Investor Relations
594 (10)%
594 (10)%
(0)
444
436
150
109
860
2
9
15
27.1
74.7%
12.6%
A vs.
A vs.
Q3 2022 Q2 2023
n.m.
(8)%
(8)%
(15)%
(18)%
3%
n.m.
(1)%
16%
(4)%
(4)%
n.m.
(6)%
(2)%
3%
5%
0%
n.m.
2%
7%
(1.9)bps (0.3)bps
1.4ppt (1.8)ppt
(2.8)ppt 0.1ppt
Q3 2023 results
October 25, 2023
Revenue and AuM performance
Revenues
fees
Perf. &
trans. Mgmt.
Other fees
p
AM
(13)
AuM, in € bn²
859
76
115
225
444
19
Q2 2023
Cash
860
78
114
229
438
Q3 2023
Alternatives
589
594
Passive
A vs. Q3
2022
(6)%
(50)%
n.m.
(10)%
Net flows, in € bn
2.3
6.2
0.6.
(1.3)
(3.3)
Q3 2023
Active ex-Cash
Key highlights
/
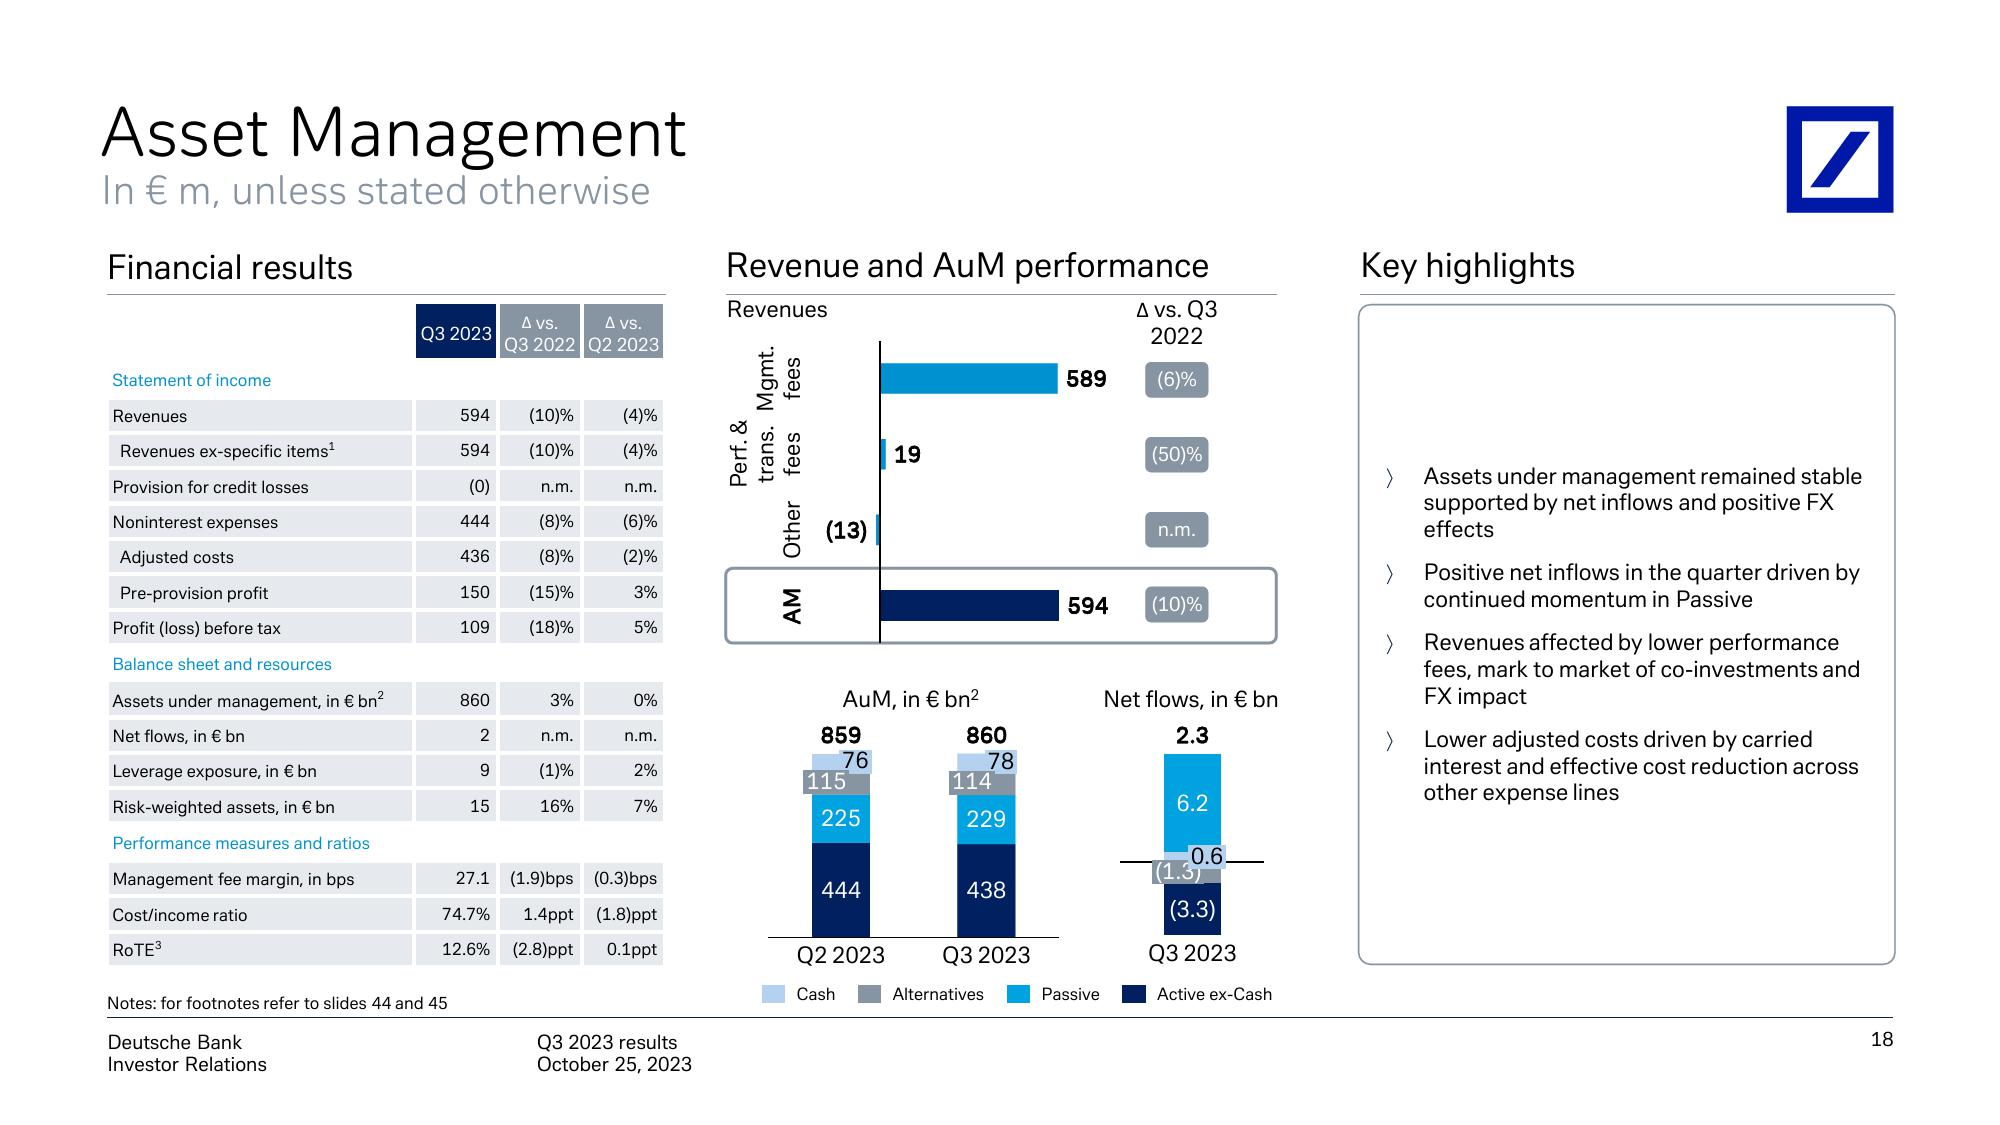
Assets under management remained stable
supported by net inflows and positive FX
effects
Positive net inflows in the quarter driven by
continued momentum in Passive
Revenues affected by lower performance
fees, mark to market of co-investments and
FX impact
Lower adjusted costs driven by carried
interest and effective cost reduction across
other expense lines
18View entire presentation