Ashtead Group Investor Day Presentation Deck slide image

Ashtead Group Investor Day Presentation Deck

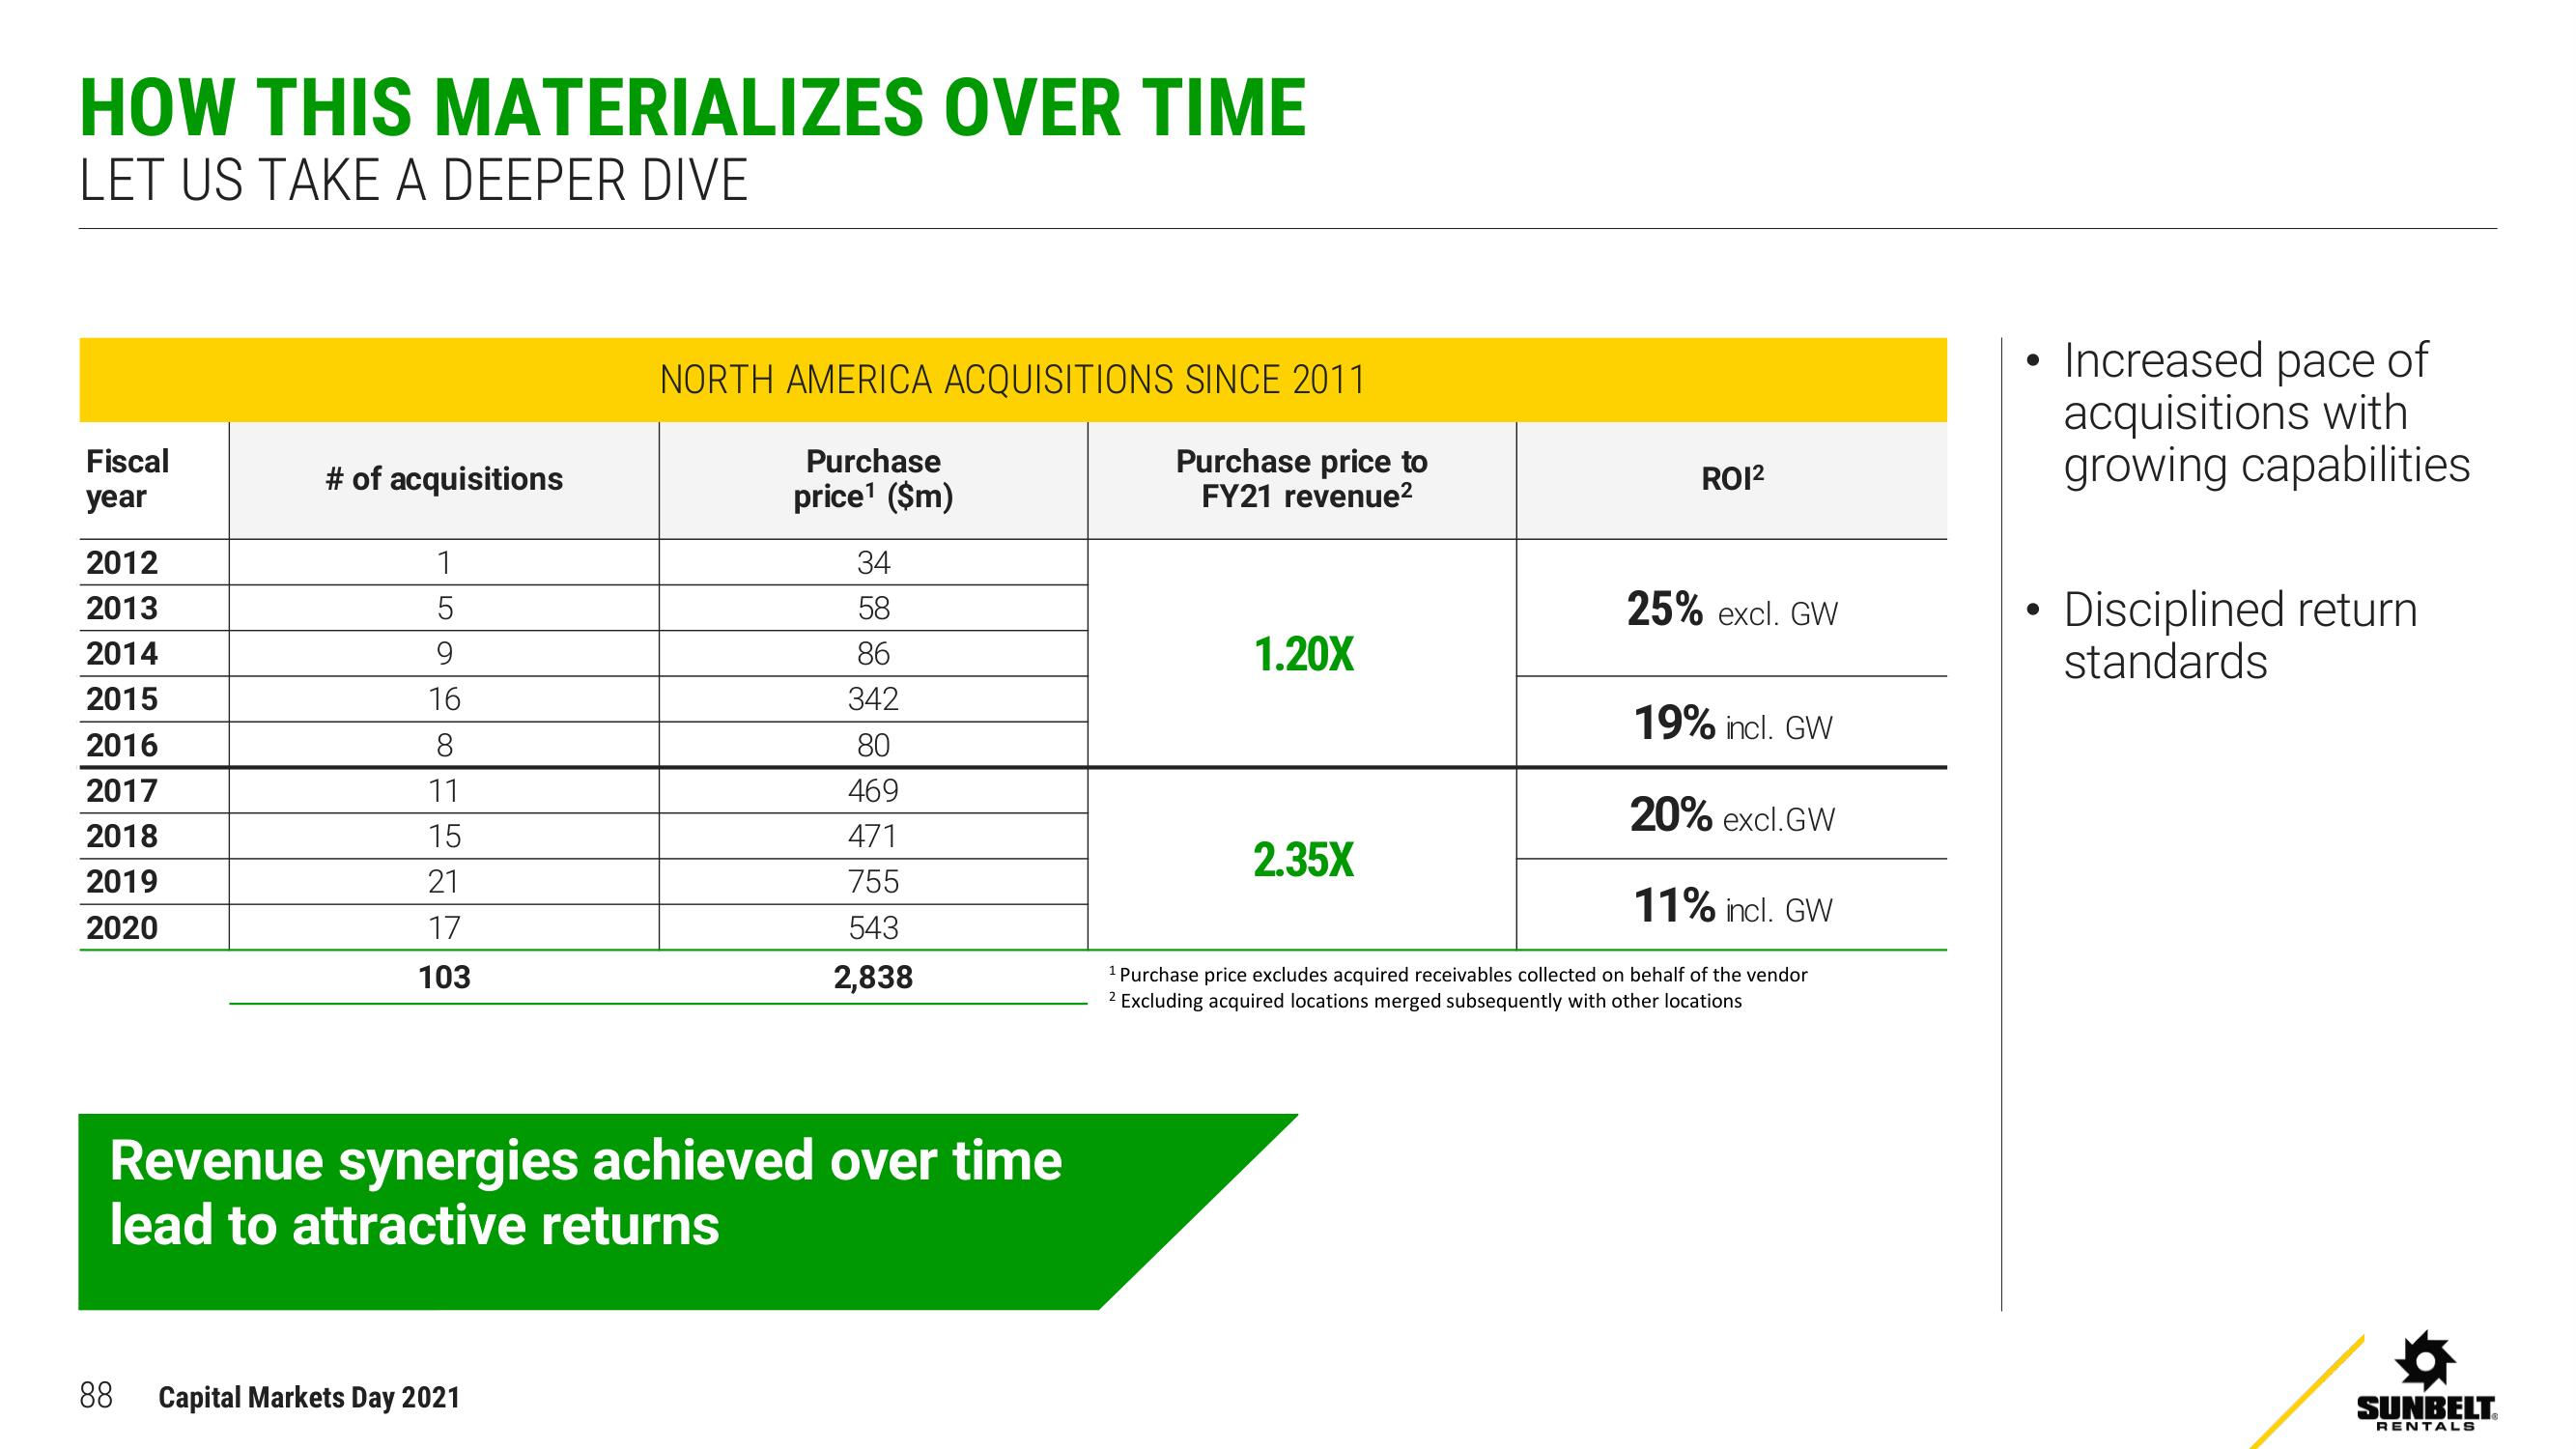
HOW THIS MATERIALIZES OVER TIME LET US TAKE A DEEPER DIVE Fiscal year 2012 2013 2014 2015 2016 2017 2018 2019 2020 # of acquisitions 88 1 5 9 16 8 11 15 21 17 103 NORTH AMERICA ACQUISITIONS SINCE 2011 Purchase price¹ ($m) Purchase price to FY21 revenue² Revenue synergies achieved over time lead to attractive returns Capital Markets Day 2021 34 58 86 342 80 469 471 755 543 2,838 1.20X RO1² 2.35X 25% excl. GW 19% incl. GW 20% excl.GW 11% incl. GW ¹ Purchase price excludes acquired receivables collected on behalf of the vendor 2 Excluding acquired locations merged subsequently with other locations Increased pace of acquisitions with growing capabilities Disciplined return standards SUNBELT. RENTALS
View entire presentation