Tradeweb Investor Presentation Deck
1.
2.
4. TANGIBLE GROWTH OPPORTUNITIES
Leading Global Electronic Rates Business
U.S. TREASURIES
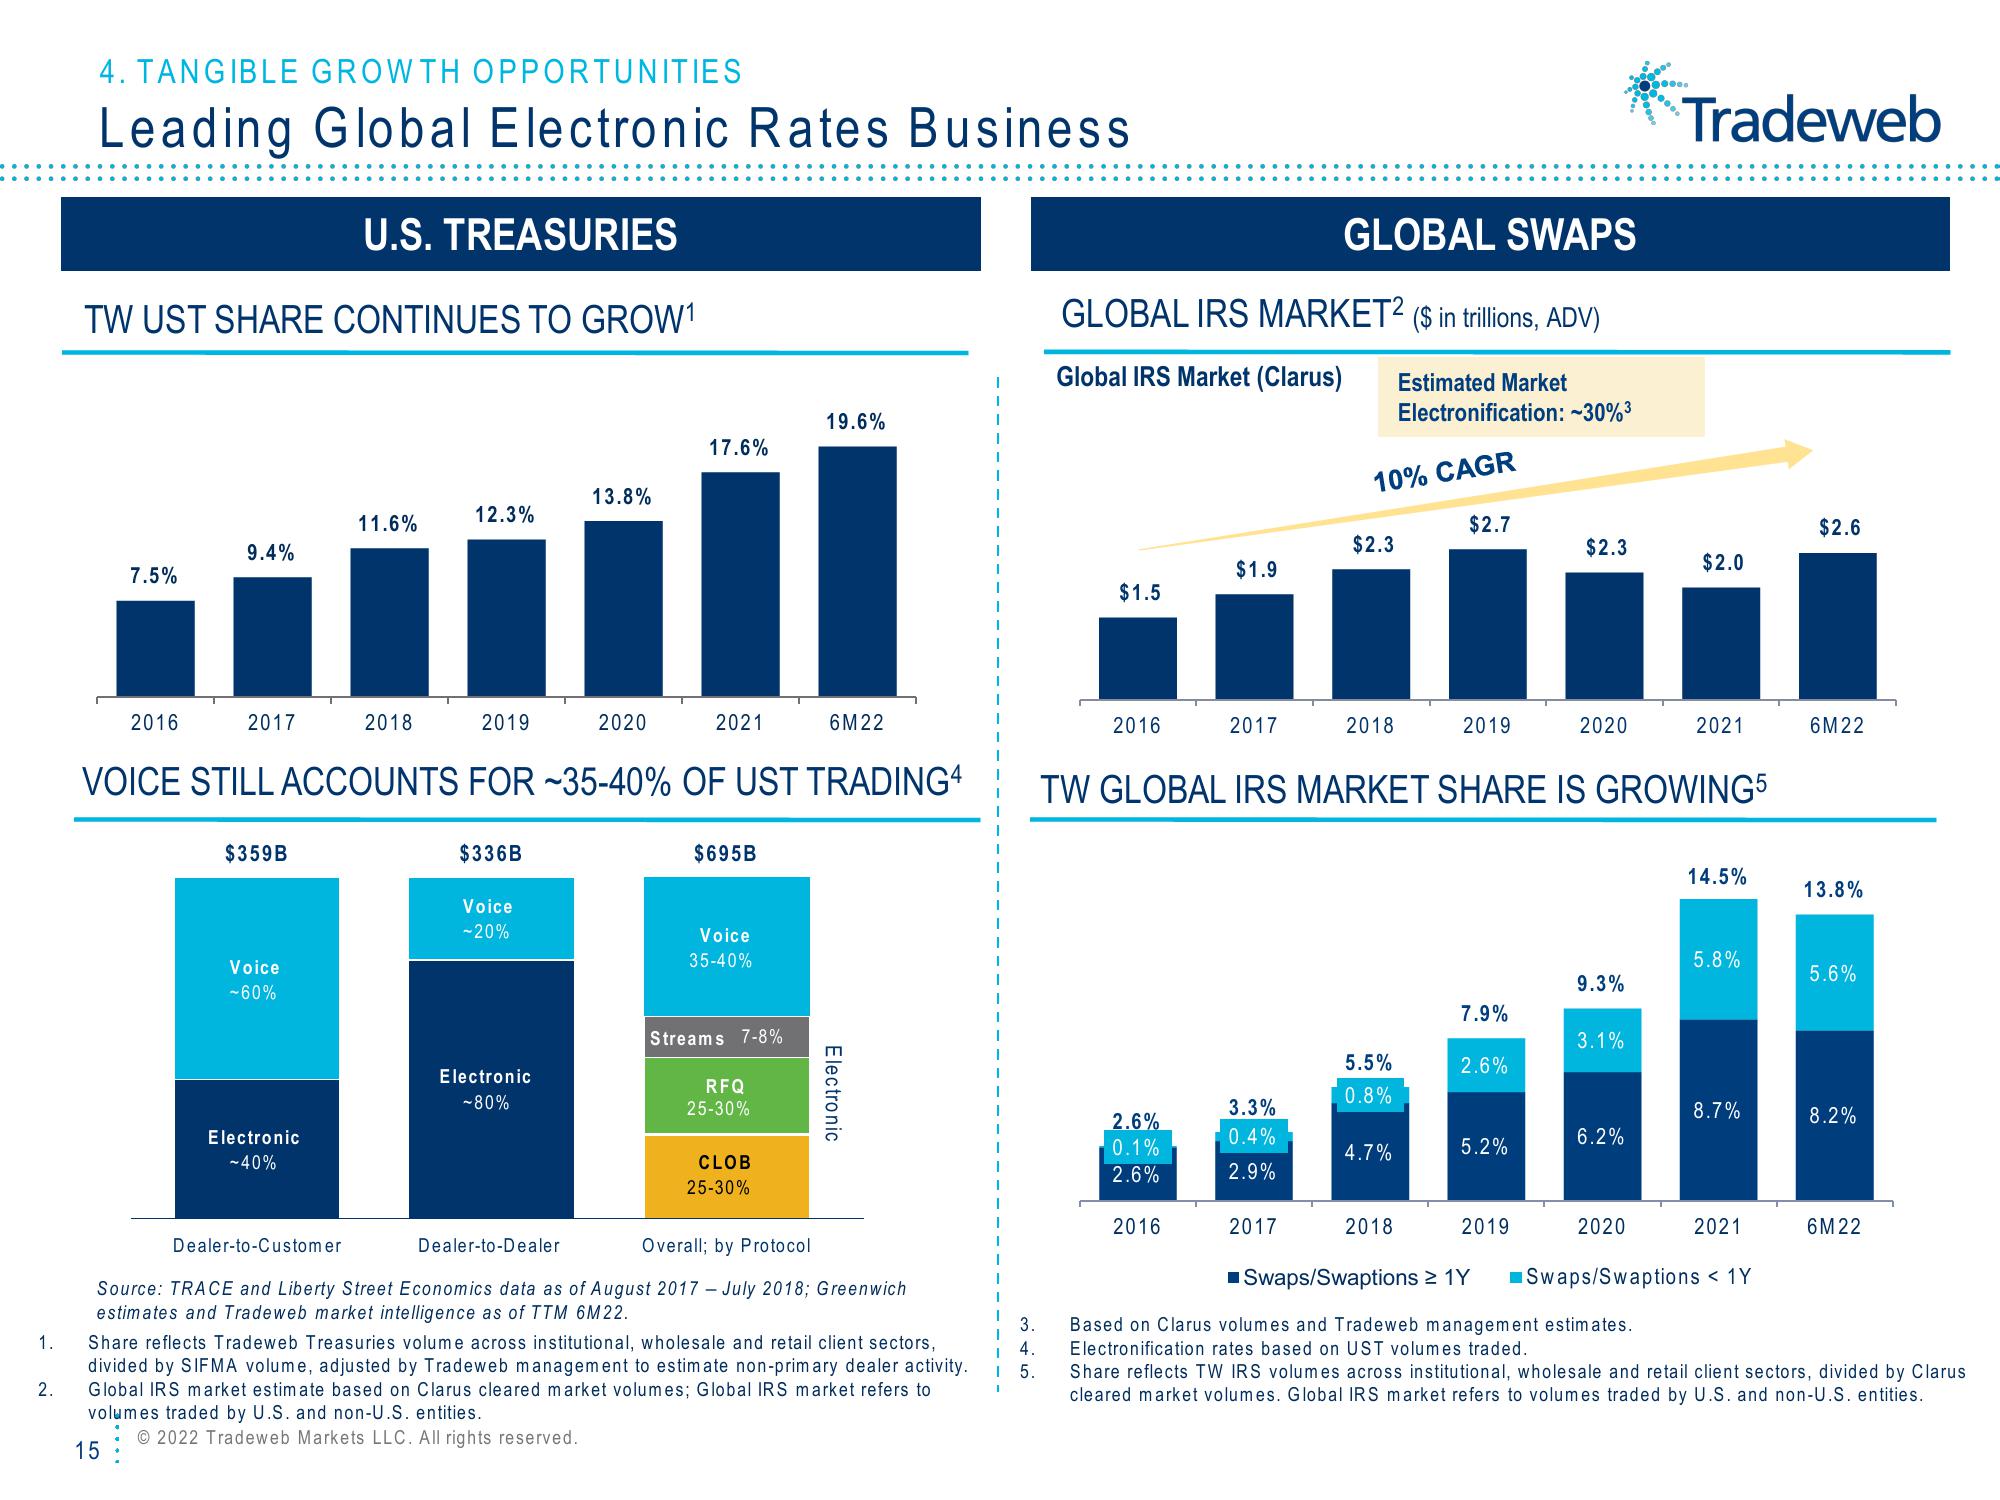
TW UST SHARE CONTINUES TO GROW¹
7.5%
2016
9.4%
2017
$359B
Voice
-60%
11.6%
Electronic
-40%
2018
12.3%
2019
$336B
Voice
-20%
VOICE STILL ACCOUNTS FOR -35-40% OF UST TRADING4
Electronic
-80%
13.8%
2020
Dealer-to-Dealer
17.6%
2021
$695B
Voice
35-40%
Streams 7-8%
RFQ
25-30%
19.6%
CLOB
25-30%
6M22
Electronic
Dealer-to-Customer
Overall; by Protocol
Source: TRACE and Liberty Street Economics data as of August 2017 July 2018; Greenwich
estimates and Tradeweb market intelligence as of TTM 6M22.
Share reflects Tradeweb Treasuries volume across institutional, wholesale and retail client sectors,
divided by SIFMA volume, adjusted by Tradeweb management to estimate non-primary dealer activity.
Global IRS market estimate based on Clarus cleared market volumes; Global IRS market refers to
volumes traded by U.S. and non-U.S. entities.
Ⓒ2022 Tradeweb Markets LLC. All rights reserved.
15
1
I
3.
1
T 4.
I 5.
GLOBAL SWAPS
GLOBAL IRS MARKET2 ($ in trillions, ADV)
Global IRS Market (Clarus)
$1.5
2016
2.6%
0.1%
2.6%
$1.9
2016
2017
3.3%
0.4%
2.9%
2017
10% CAGR
$2.3
2018
5.5%
0.8%
Estimated Market
Electronification: -30%³
4.7%
2018
$2.7
2019
TW GLOBAL IRS MARKET SHARE IS GROWING5
7.9%
2.6%
5.2%
$2.3
2019
2020
9.3%
3.1%
6.2%
2020
....
Tradeweb
■Swaps/Swaptions ≥ 1Y
Based on Clarus volumes and Tradeweb management estimates.
Electronification rates based on UST volumes traded.
$2.0
2021
14.5%
5.8%
8.7%
2021
Swaps/Swaptions < 1Y
$2.6
6M22
13.8%
5.6%
8.2%
6M22
Share reflects TW IRS volumes across institutional, wholesale and retail client sectors, divided by Clarus
cleared market volumes. Global IRS market refers to volumes traded by U.S. and non-U.S. entities.View entire presentation