Trian Partners Activist Presentation Deck
Confidential-Not for Reproduction or Distribution
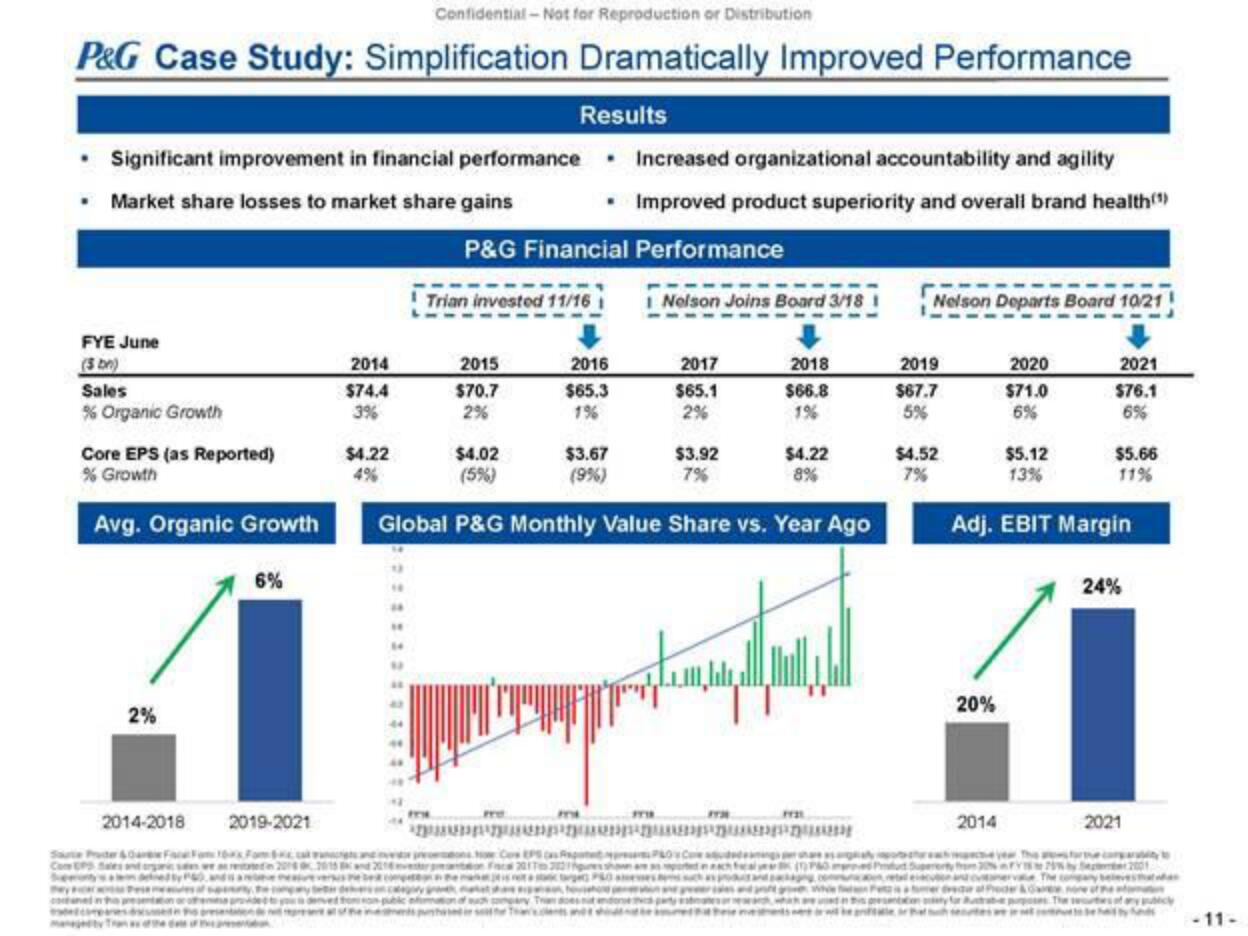
P&G Case Study: Simplification Dramatically Improved Performance
Significant improvement in financial performance Increased organizational accountability and agility
• Market share losses to market share gains
• Improved product superiority and overall brand health(")
P&G Financial Performance
FYE June
Sales
% Organic Growth
Core EPS (as Reported)
% Growth
Avg. Organic Growth
6%
2%
2014-2018
Com CPD Sales
2019-2021
2014
$74.4
3%
$4.22
Trian invested 11/16 1
2015
$70.7
2%
Results
$4.02
Fre
2016
$65.3
1%
$3.67
(9%)
1 Nelson Joins Board 3/18 1
2017
$65.1
2%
$3.92
7%
2018
$66.8
1%
$4.22
8%
Global P&G Monthly Value Share vs. Year Ago
kanya dan t
Fr
-Անկարանը կա
Nelson Departs Board 10/21
2019
$67.7
5%
$4.52
7%
20%
2020
$71.0
6%
$5.12
13%
Adj. EBIT Margin
2014
2021
$76.1
6%
$5.66
11%
24%
2021
75% by S2001
-11-View entire presentation