DigitalOcean Results Presentation Deck
ņ
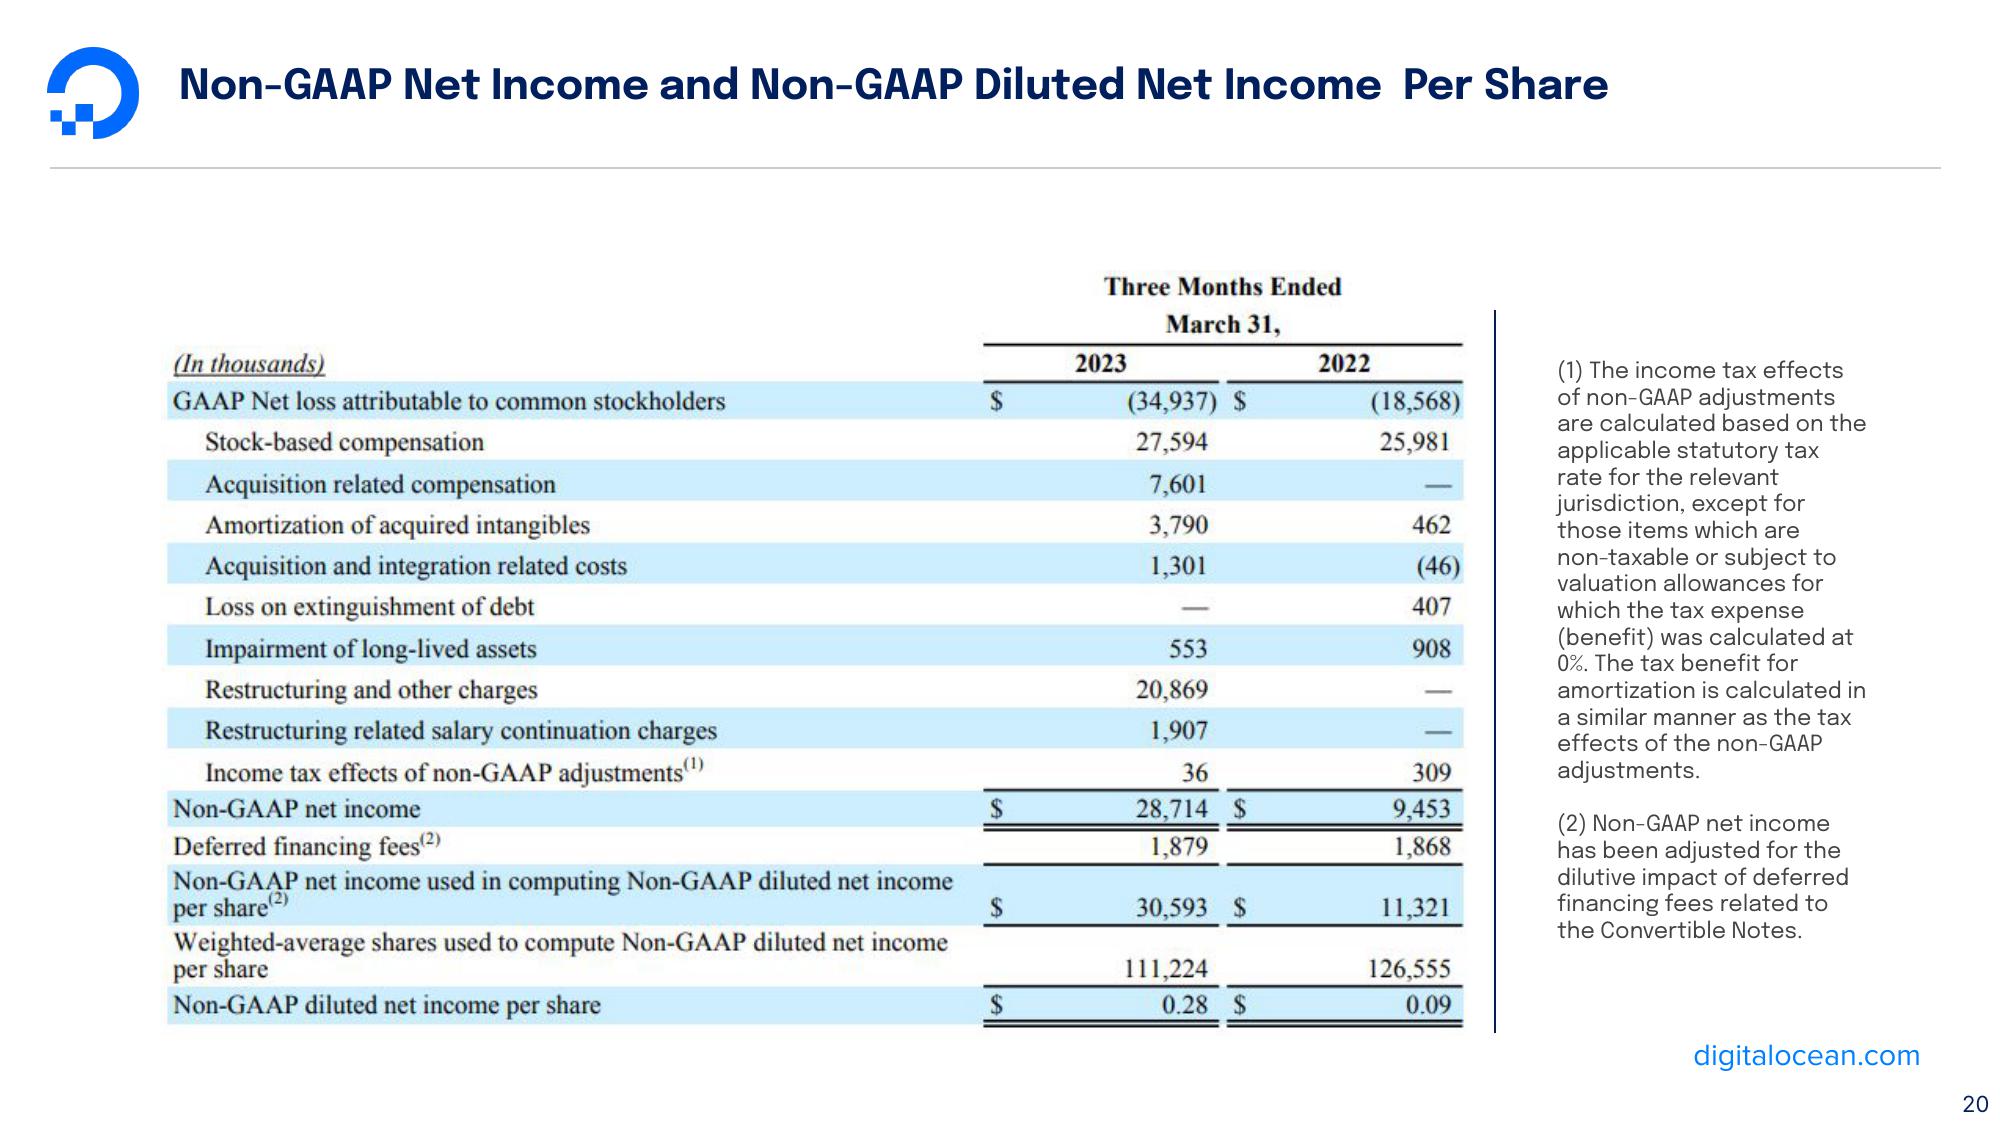
Non-GAAP Net Income and Non-GAAP Diluted Net Income Per Share
(In thousands)
GAAP Net loss attributable to common stockholders
Stock-based compensation
Acquisition related compensation
Amortization of acquired intangibles
Acquisition and integration related costs
Loss on extinguishment of debt
Impairment of long-lived assets
Restructuring and other charges
Restructuring related salary continuation charges
Income tax effects of non-GAAP adjustments(¹)
Non-GAAP net income
Deferred financing fees(2)
Non-GAAP net income used in computing Non-GAAP diluted net income
per share (2)
Weighted-average shares used to compute Non-GAAP diluted net income
per share
Non-GAAP diluted net income per share
$
$
$
$
Three Months Ended
March 31,
2023
(34,937) $
27,594
7,601
3,790
1,301
553
20,869
1,907
36
28,714 $
1,879
30,593 $
111,224
0.28 $
2022
(18,568)
25,981
462
(46)
407
908
309
9,453
1,868
11,321
126,555
0.09
(1) The income tax effects
of non-GAAP adjustments
are calculated based on the
applicable statutory tax
rate for the relevant
jurisdiction, except for
those items which are
non-taxable or subject to
valuation allowances for
which the tax expense
(benefit) was calculated at
0%. The tax benefit for
amortization is calculated in
a similar manner as the tax
effects of the non-GAAP
adjustments.
(2) Non-GAAP net income
has been adjusted for the
dilutive impact of deferred
financing fees related to
the Convertible Notes.
digitalocean.com
20View entire presentation