Goldman Sachs Investment Banking Pitch Book
Goldman
Sachs
Illustrative WACC Analysis
Ferdinand WACC
Ferdinand Standalone WACC
Capital Structure
Debt / Capital
Equity / Capital
Risk Free Rate
Equity Beta
Equity Risk Premium
Cost of Equity
Equity Beta
Illustrative WACC
Cost of Equity
Pre-Tax Cost of Debt
Marginal Tax Rate
After-Tax Cost of Debt
35 %
1.50 10.29 %
1.55 10.49
1.60 10.69
1.65 10.88
1.70 11.08
Cost of Debt
WACC
Debt/ Capital Ratio
40 %
9.92 %
45 % 50 %
9.18%
9.55%
10.10
9.72
10.29
9.89
10.47 10.05
10.65 10.22
9.33
9.48
9.64
9.79
45 %
55 %
3.73%
1.60
6.10 %
13.49%
7.51 %
27.0%
5.48%
9.89%
55 %
8.81%
8.95
9.08
9.22
9.36
Beta
2.00
1.75
1.50
1.25
1.00
Average
Ferdinand
Brokerage /Wealth'
Jan-2019
Dec-2019
Historical Beta
Current
1.67 x
1.11
1Y
1.50 x
1.26
Dec-2020
INVESTMENT BANKING
DIVISION
2Y
1.52 x
1.40
CONFIDENTIAL
3Y
1.55 X
1.45
Mus
Dec-2021
Ferdinand
-Brokerage / Wealth'
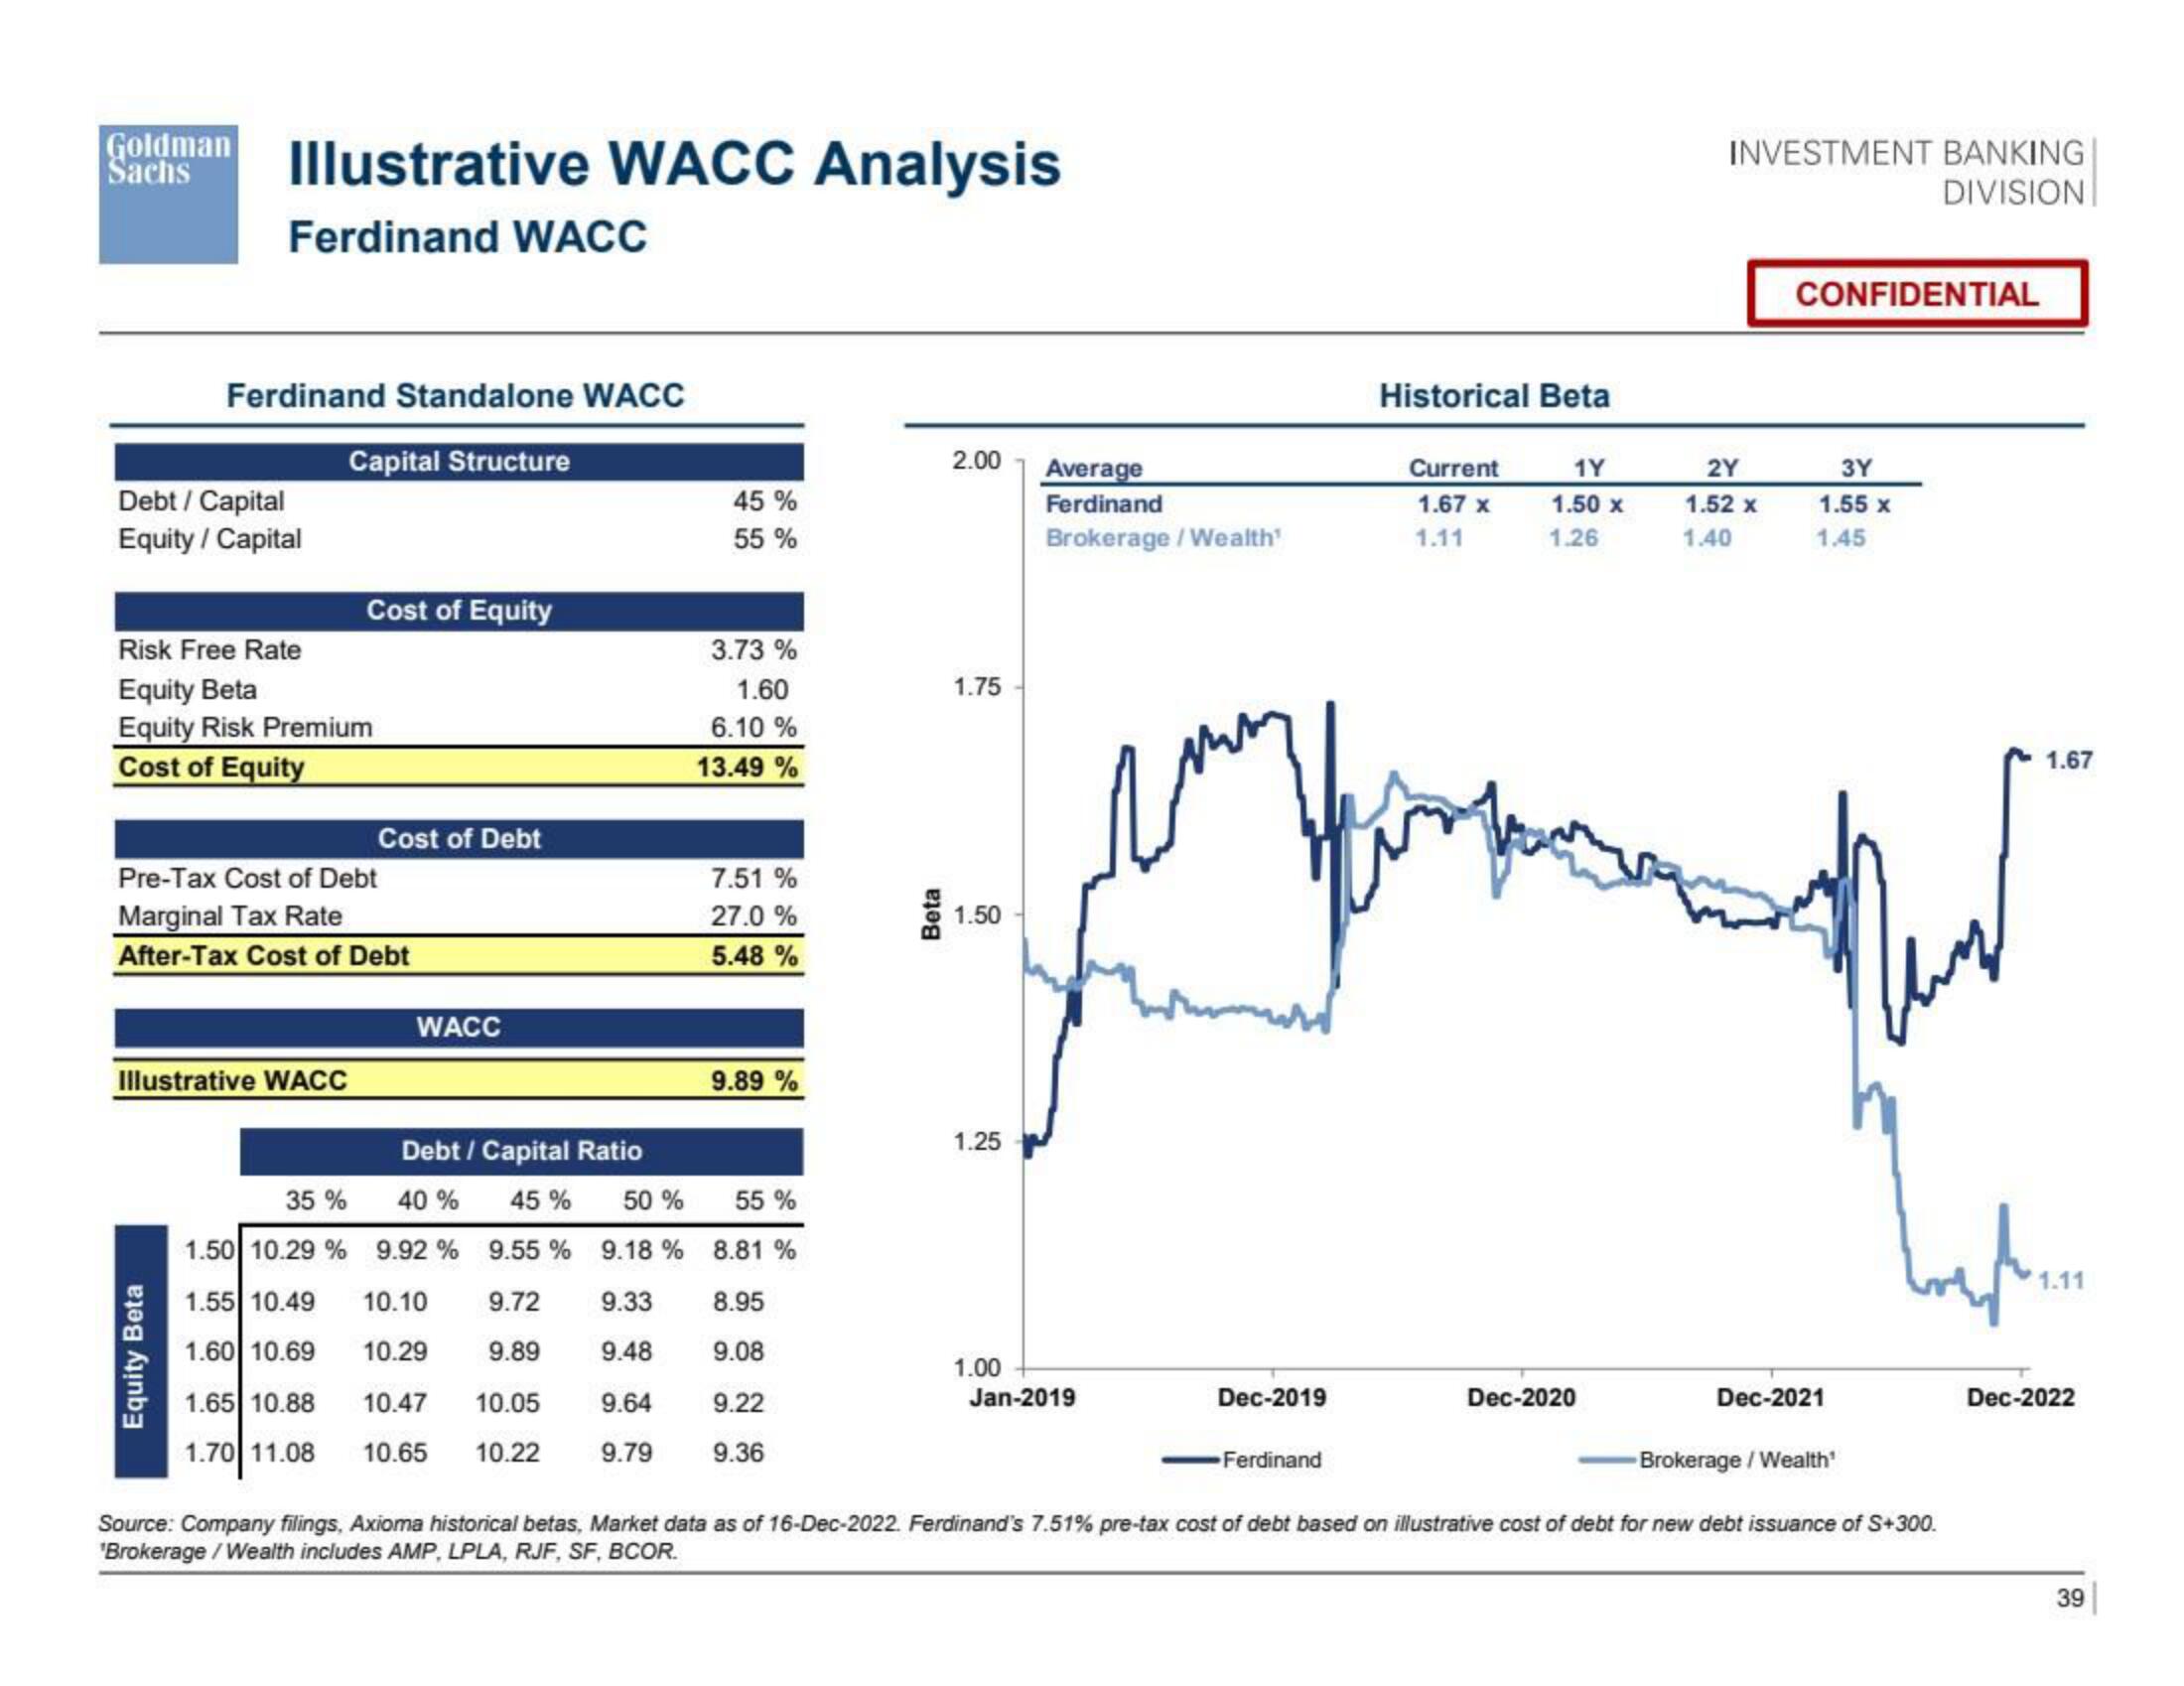
Source: Company filings, Axioma historical betas, Market data as of 16-Dec-2022. Ferdinand's 7.51% pre-tax cost of debt based on illustrative cost of debt for new debt issuance of S+300.
'Brokerage / Wealth includes AMP, LPLA, RJF, SF, BCOR.
1.67
1.11
Dec-2022
39View entire presentation