Doma SPAC Presentation Deck
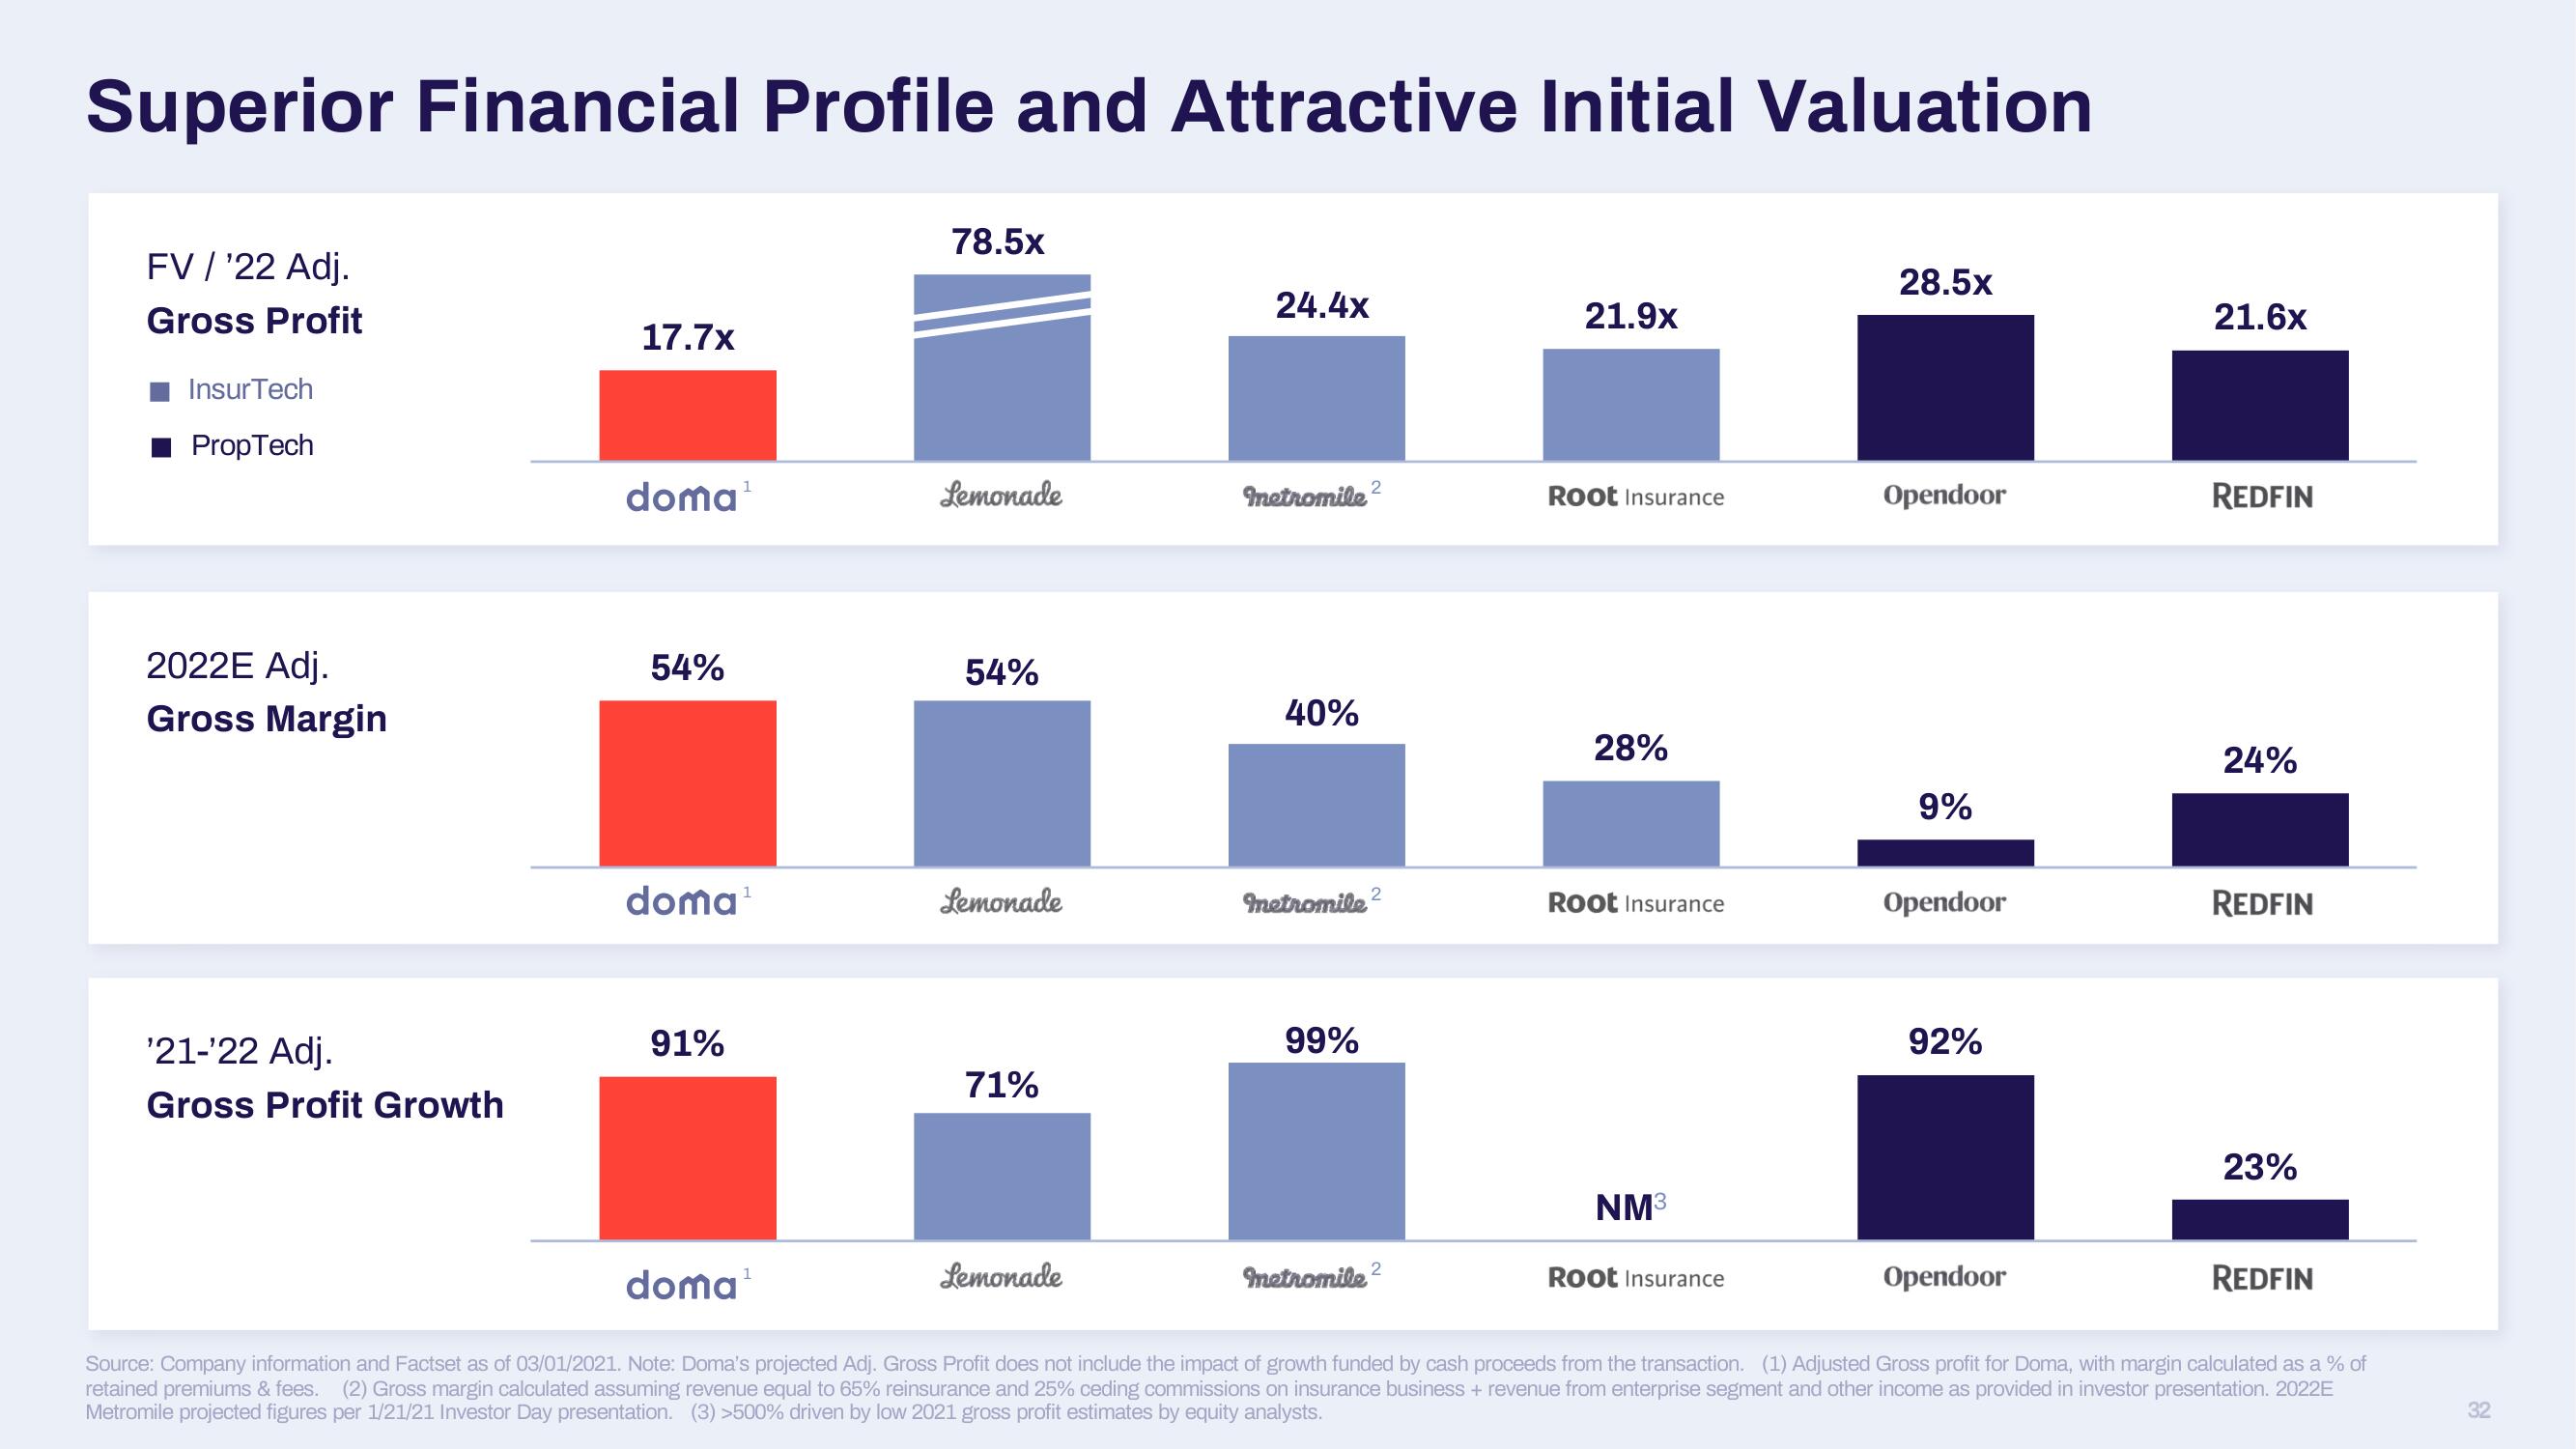
Superior Financial Profile and Attractive Initial Valuation
FV / '22 Adj.
Gross Profit
Insur Tech
Tech
2022E Adj.
Gross Margin
'21-'22 Adj.
Gross Profit Growth
17.7x
doma¹
54%
doma¹
91%
78.5x
Lemonade
54%
Lemonade
71%
Lemonade
24.4x
metromile ²
40%
metromile 2
99%
metromile²
21.9x
Root Insurance
28%
Root Insurance
NM³
Root Insurance
28.5x
Opendoor
9%
Opendoor
92%
Opendoor
21.6x
REDFIN
24%
REDFIN
23%
REDFIN
doma¹
Source: Company information and Factset as of 03/01/2021. Note: Doma's projected Adj. Gross Profit does not include the impact of growth funded by cash proceeds from the transaction. (1) Adjusted Gross profit for Doma, with margin calculated as a % of
retained premiums & fees. (2) Gross margin calculated assuming revenue equal to 65% reinsurance and 25% ceding commissions on insurance business + revenue from enterprise segment and other income as provided in investor presentation. 2022E
Metromile projected figures per 1/21/21 Investor Day presentation. (3) >500% driven by low 2021 gross profit estimates by equity analysts.
32View entire presentation