Verint SPAC Presentation Deck slide image

Verint SPAC Presentation Deck

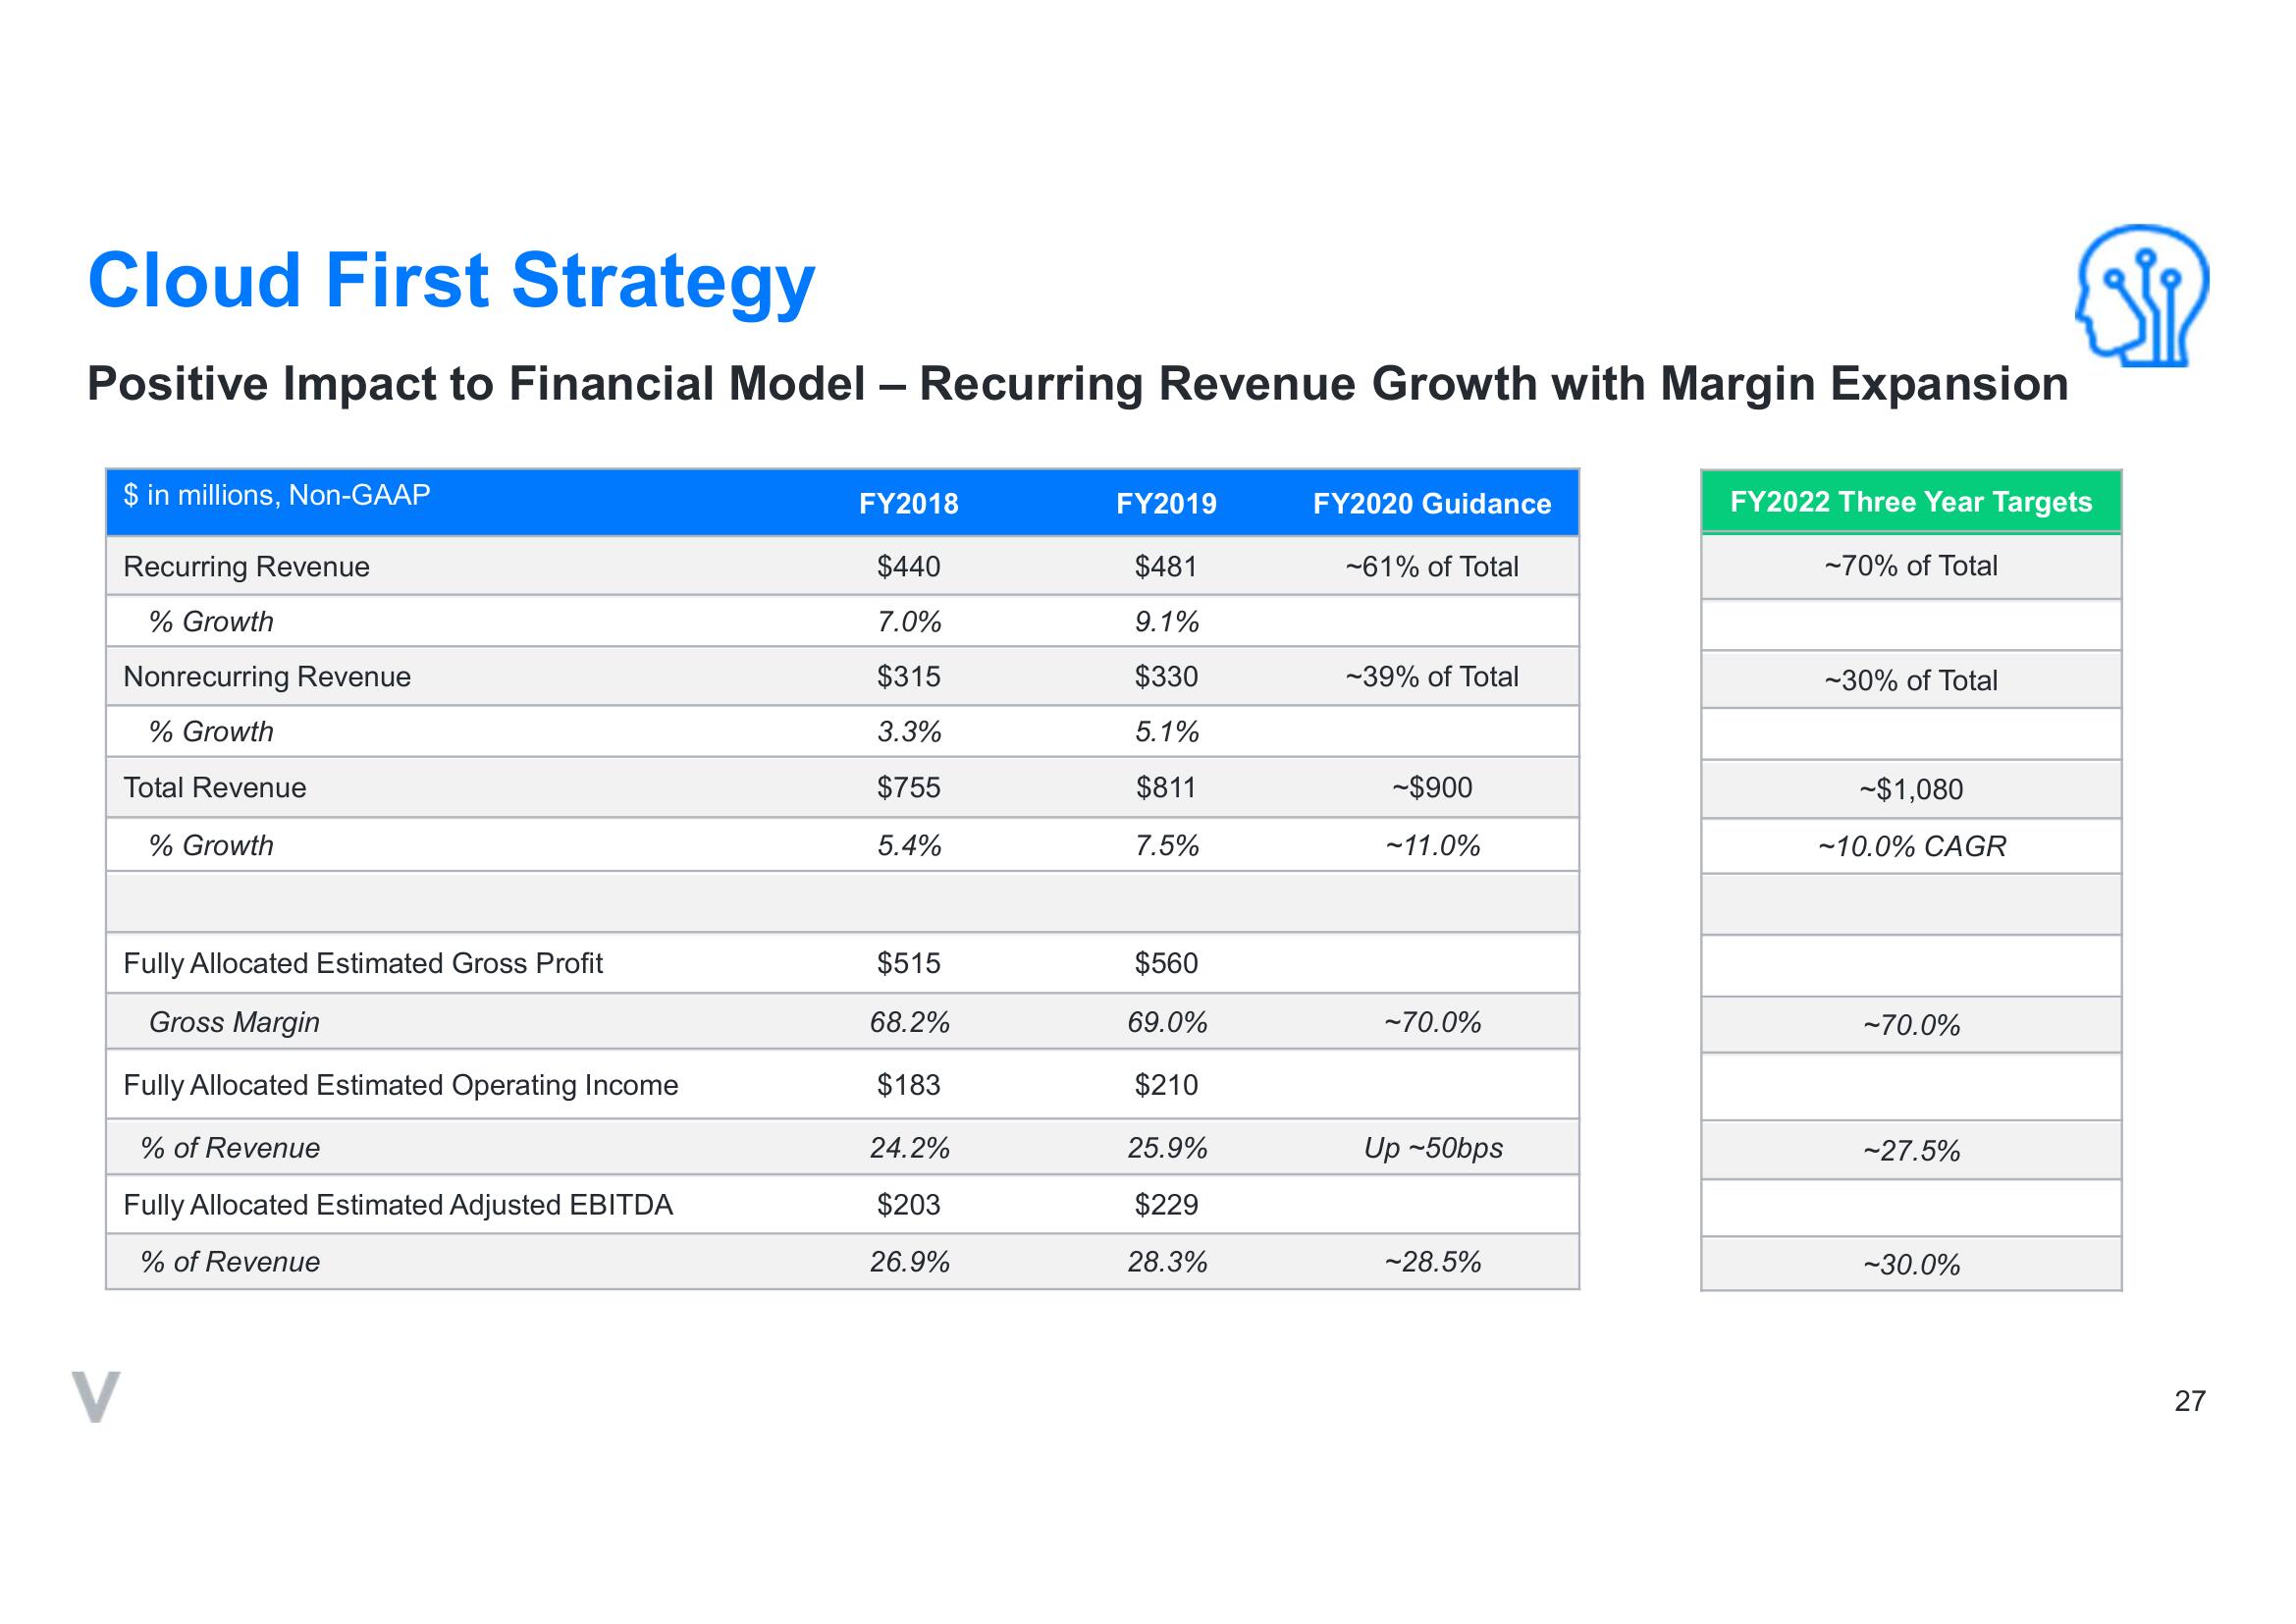
Cloud First Strategy Positive Impact to Financial Model - Recurring Revenue Growth with Margin Expansion $ in millions, Non-GAAP Recurring Revenue % Growth Nonrecurring Revenue % Growth Total Revenue % Growth Fully Allocated Estimated Gross Profit Gross Margin Fully Allocated Estimated Operating Income % of Revenue Fully Allocated Estimated Adjusted EBITDA % of Revenue FY2018 $440 7.0% $315 3.3% $755 5.4% $515 68.2% $183 24.2% $203 26.9% FY2019 $481 9.1% $330 5.1% $811 7.5% $560 69.0% $210 25.9% $229 28.3% FY2020 Guidance ~61% of Total -39% of Total -$900 ~11.0% ~70.0% Up-50bps ~28.5% FY2022 Three Year Targets ~70% of Total -30% of Total ~$1,080 -10.0% CAGR ~70.0% ~27.5% ~30.0% 27
View entire presentation