Crocs Results Presentation Deck
cr
CS
cr
OCS
CI
OC
Cl
BRAND PERFORMANCE
CROCS BRAND Q1 HIGHLIGHTS
• Crocs brand revenues +22% CC vs. PY
●
●
●
Digital revenue growth +23% CC vs. PY
• DTC growth of +20% CC vs. PY
O
O
• North America DTC growth of +19% vs. PY
O
Ranked #6 in Piper Sandler's Spring 2022 Taking Stock
with Teens survey, up two spots from last year
Launched innovative digital marketing campaigns with
Karol G & Spotify
1.
2.
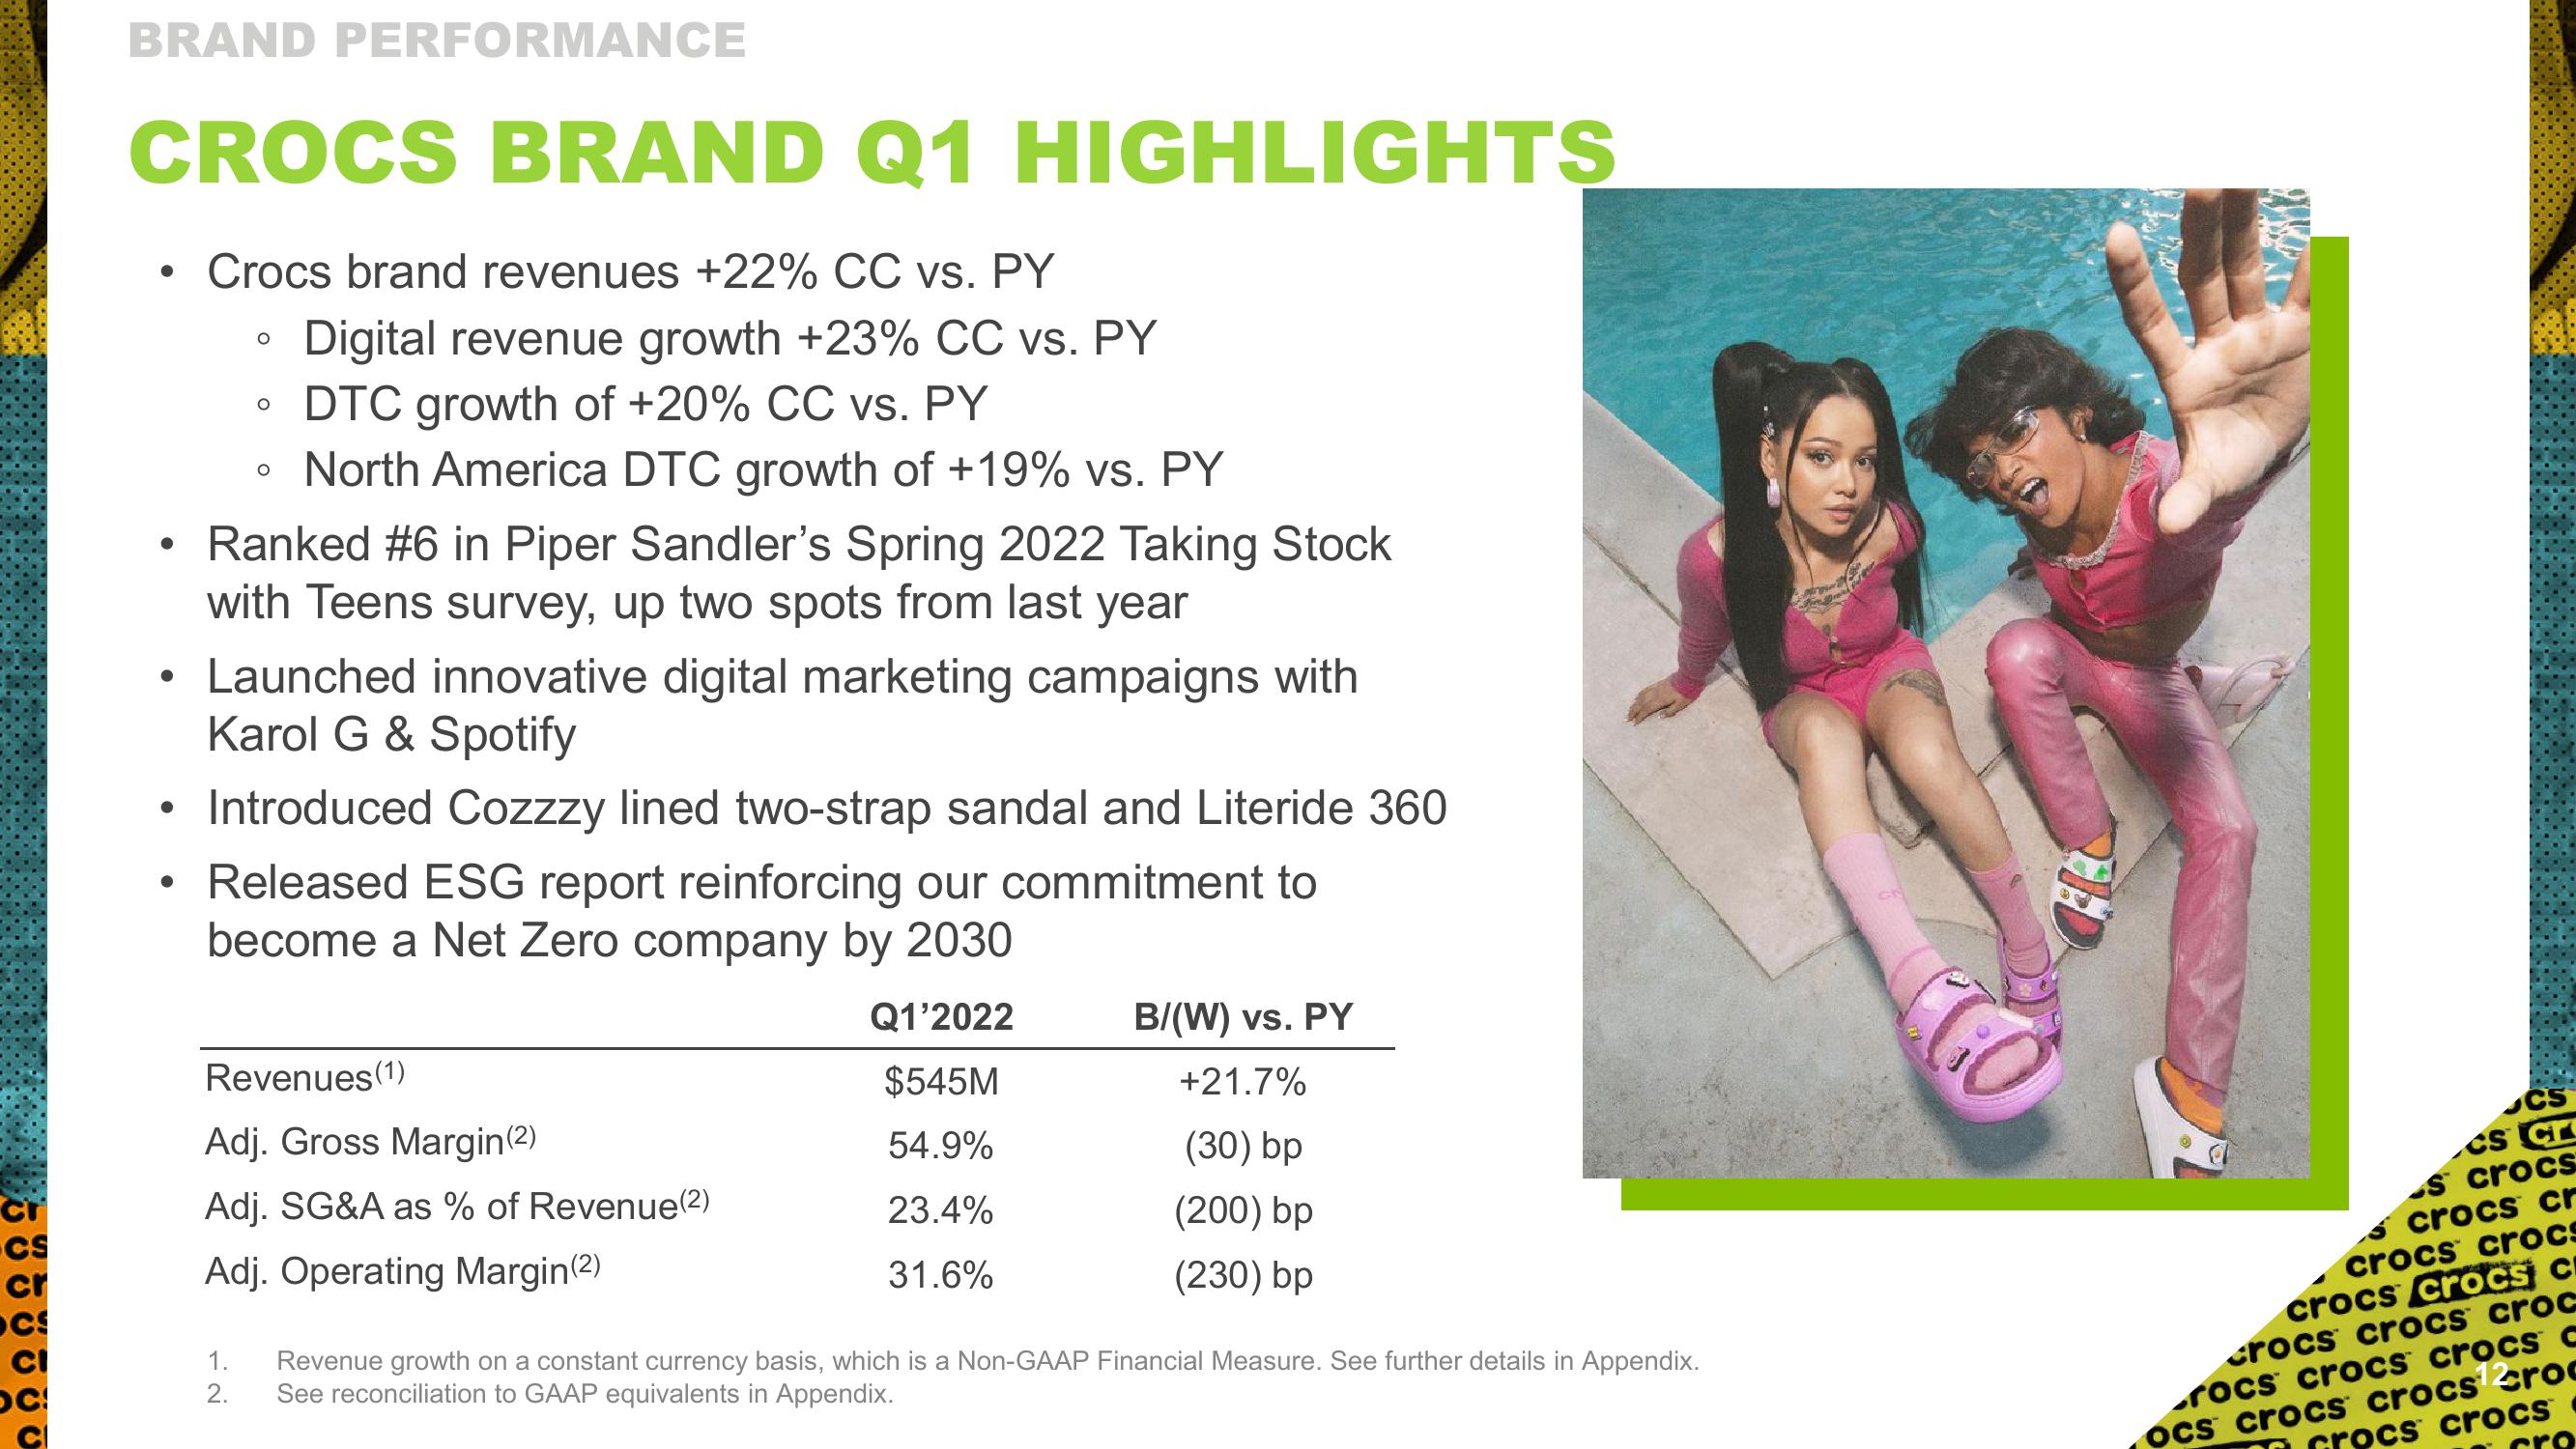
Introduced Cozzzy lined two-strap sandal and Literide 360
Released ESG report reinforcing our commitment to
become a Net Zero company by 2030
Q1'2022
$545M
54.9%
23.4%
31.6%
Revenues (1)
Adj. Gross Margin(2)
Adj. SG&A as % of Revenue(2)
Adj. Operating Margin(2)
B/(W) vs. PY
+21.7%
(30) bp
(200) bp
(230) bp
Revenue growth on a constant currency basis, which is a Non-GAAP Financial Measure. See further details in Appendix.
See reconciliation to GAAP equivalents in Appendix.
GO
CS
CS C
s crocs
crocs cr
crocs crocs
crocs crocs C
crocs crocs croc
rocs crocs crocs c
ocs crocs crocs¹2roc
Grocs crocsView entire presentation