Sonos Results Presentation Deck
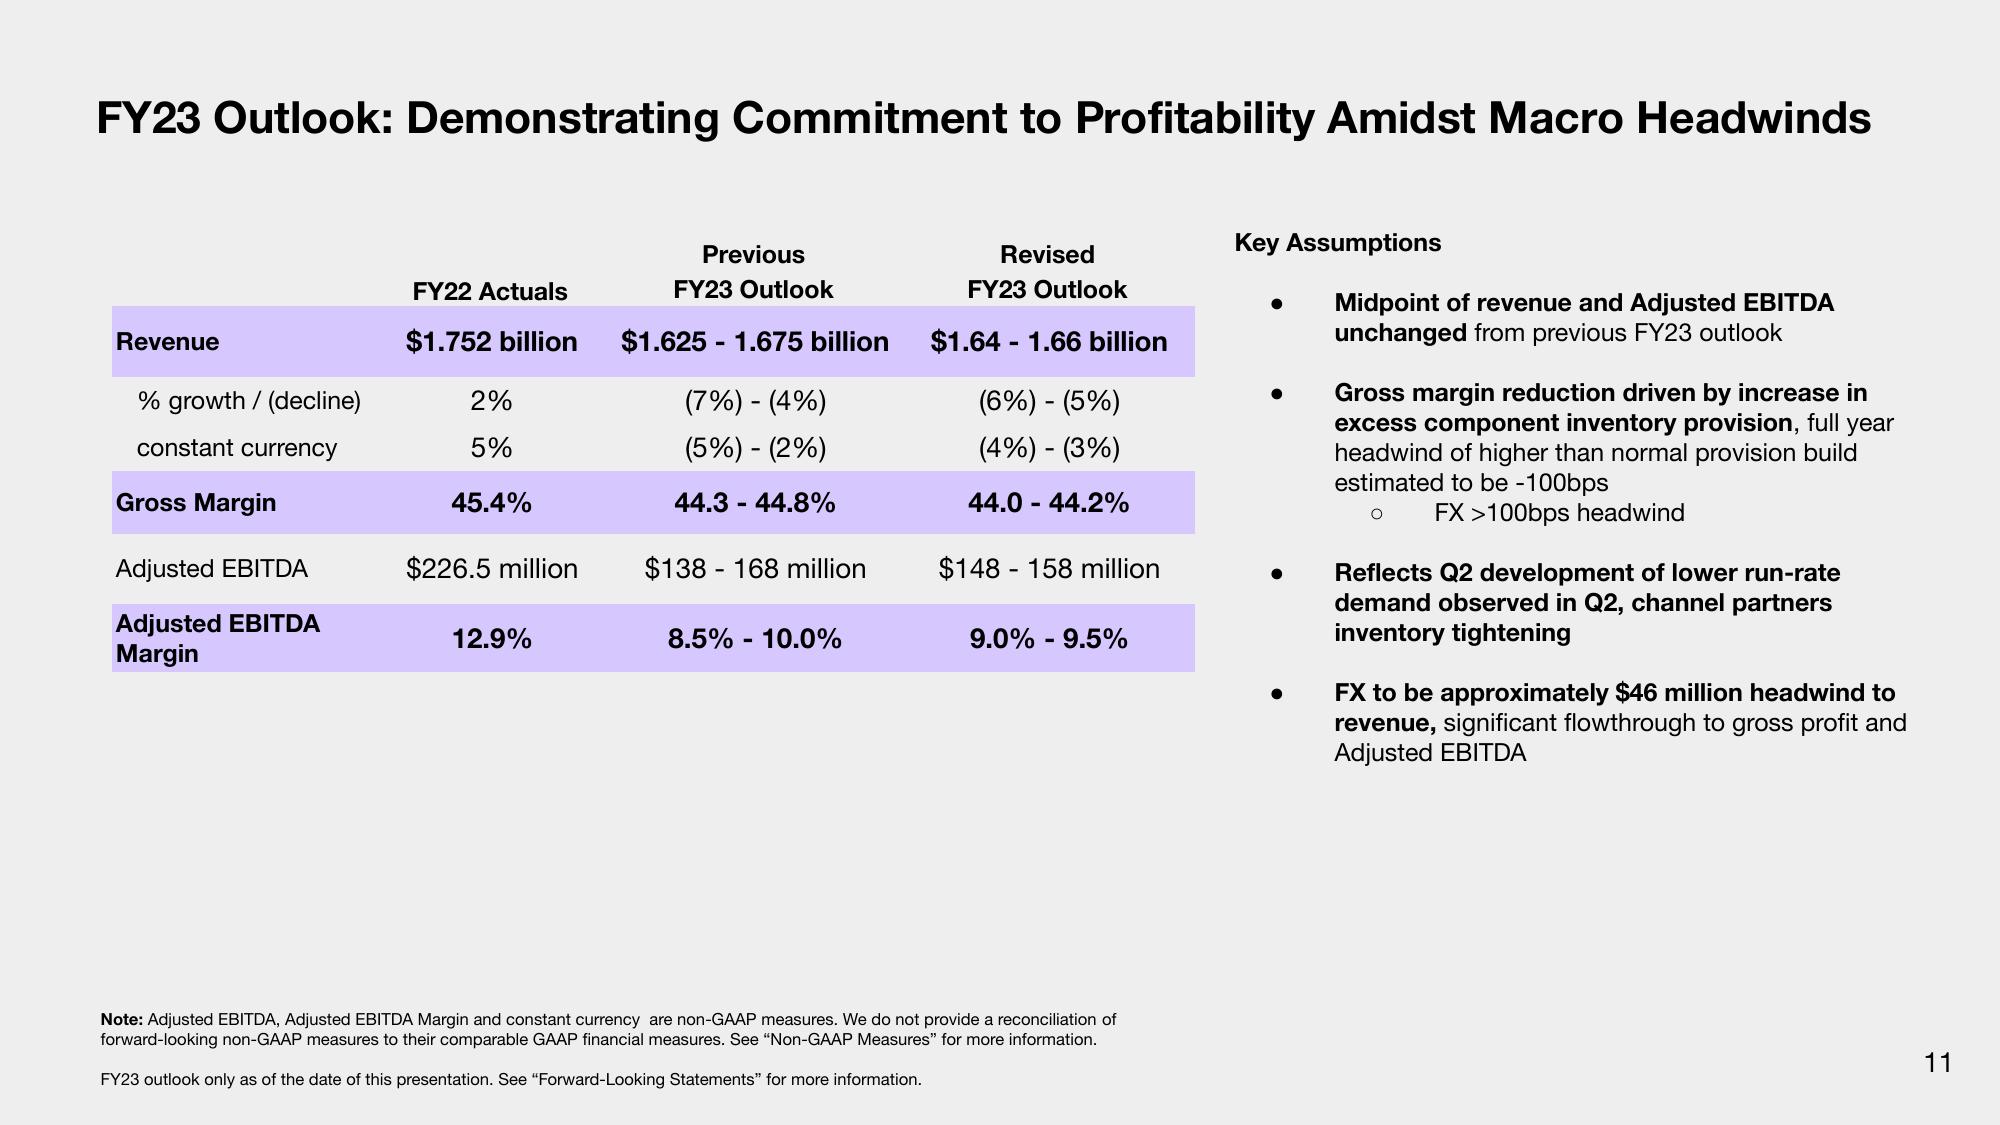
FY23 Outlook: Demonstrating Commitment to Profitability Amidst Macro Headwinds
Revenue
% growth / (decline)
constant currency
Gross Margin
Adjusted EBITDA
Adjusted EBITDA
Margin
FY22 Actuals
$1.752 billion
2%
5%
45.4%
$226.5 million
12.9%
Previous
FY23 Outlook
$1.625 1.675 billion
-
(7%) - (4%)
(5%) - (2%)
44.3 - 44.8%
$138 168 million
8.5% - 10.0%
Revised
FY23 Outlook
$1.641.66 billion
(6%) - (5%)
(4%) - (3%)
44.0 - 44.2%
$148 158 million
9.0% - 9.5%
Note: Adjusted EBITDA, Adjusted EBITDA Margin and constant currency are non-GAAP measures. We do not provide a reconciliation of
forward-looking non-GAAP measures to their comparable GAAP financial measures. See "Non-GAAP Measures" for more information.
FY23 outlook only as of the date of this presentation. See "Forward-Looking Statements" for more information.
Key Assumptions
Midpoint of revenue and Adjusted EBITDA
unchanged from previous FY23 outlook
Gross margin reduction driven by increase in
excess component inventory provision, full year
headwind of higher than normal provision build
estimated to be -100bps
O
FX >100bps headwind
Reflects Q2 development of lower run-rate
demand observed in Q2, channel partners
inventory tightening
FX to be approximately $46 million headwind to
revenue, significant flowthrough to gross profit and
Adjusted EBITDA
11View entire presentation