AMD Results Presentation Deck
APPENDICES
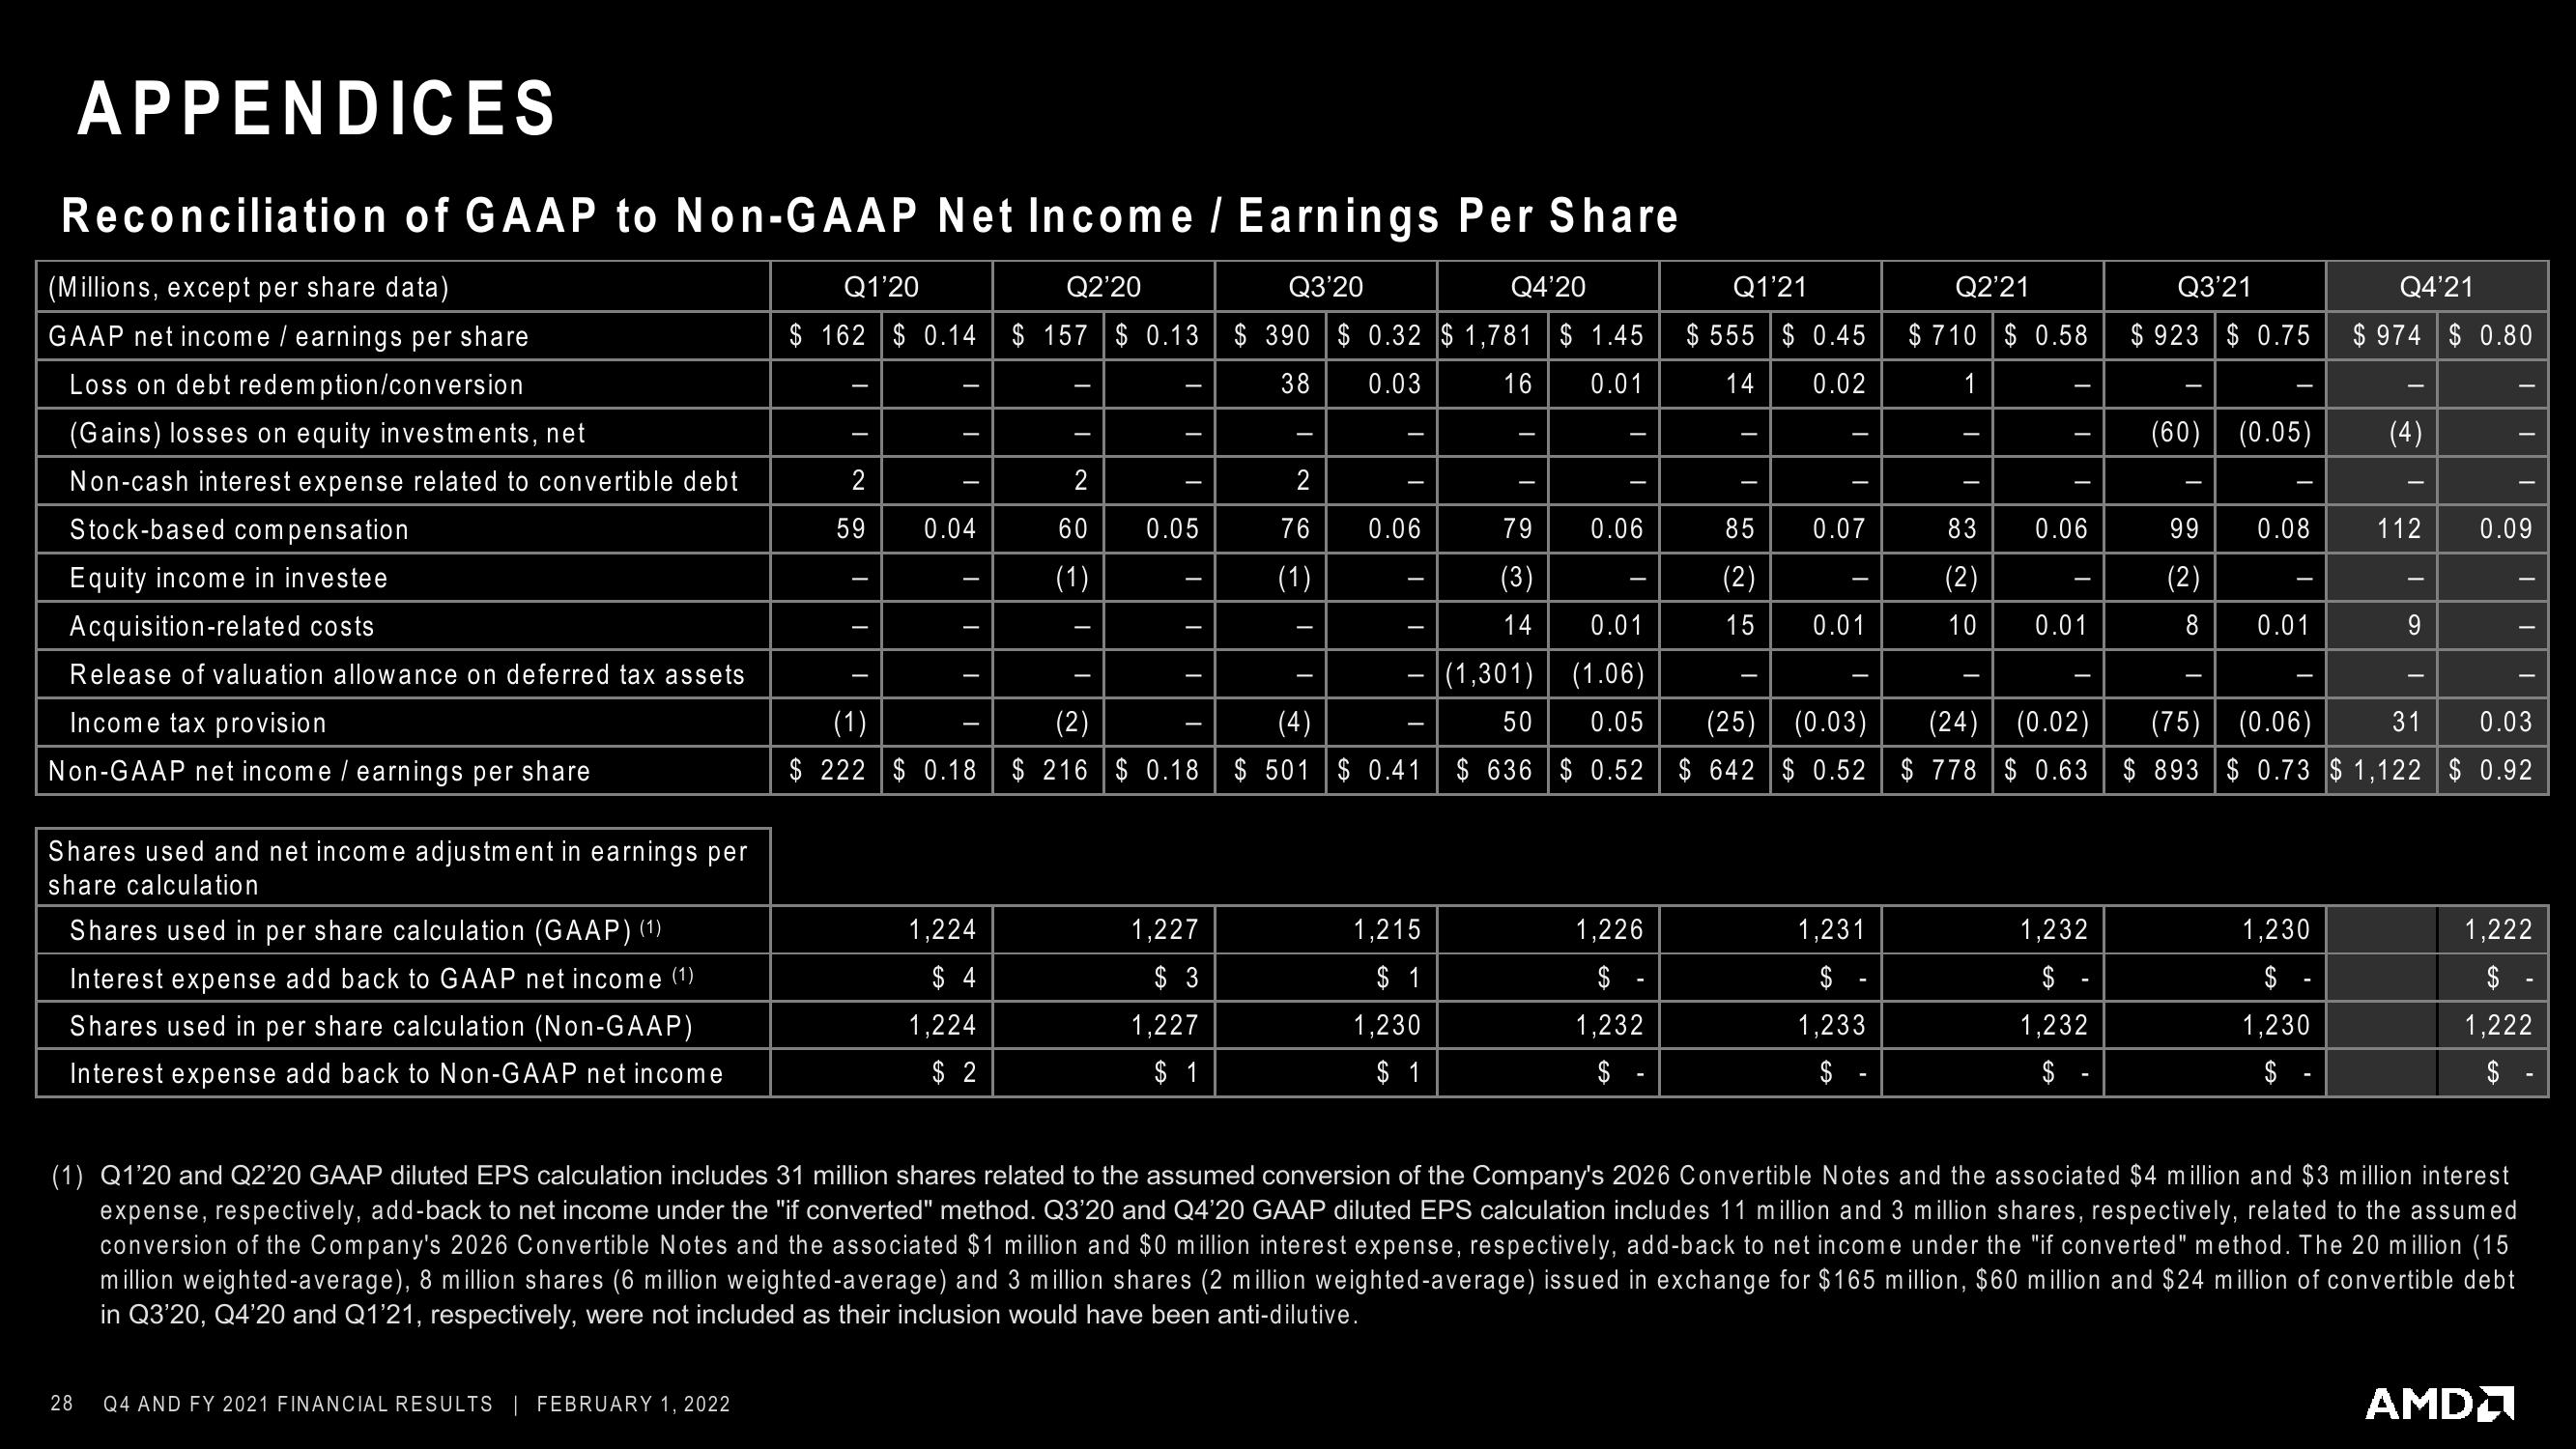
Reconciliation of GAAP to Non-GAAP Net Income / Earnings Per Share
(Millions, except per share data)
Q1'20
Q2'20
Q3'20
GAAP net income / earnings per share
$ 162 $0.14 $ 157 $ 0.13
Loss on debt redemption/conversion
(Gains) losses on equity investments, net
Non-cash interest expense related to convertible debt
Stock-based compensation
Equity income in investee
Acquisition-related costs
Release of valuation allowance on deferred tax assets
Income tax provision
Non-GAAP net income / earnings per share
Shares used and net income adjustment in earnings per
share calculation
Shares used in per share calculation (GAAP) (1)
Interest expense add back to GAAP net income (1)
Shares used in per share calculation (Non-GAAP)
Interest expense add back to Non-GAAP net income
28
I
Q4 AND FY 2021 FINANCIAL RESULTS | FEBRUARY 1, 2022
I
-
2
59
I
I
T
I
I
T
0.04
-
I
T
I
1,224
$ 4
1,224
$ 2
I
2
60 0.05
(1)
I
-
I
(2)
-
-
I
I
Q4'20
Q1'21
$390 $0.32 $ 1,781 $ 1.45 $ 555 $ 0.45
38
0.03
16 0.01
14
0.02
1,227
$ 3
1,227
$ 1
-
2
76
(1)
I
—
I
I
0.06
-
(1)
(4)
$ 222 $ 0.18 $216 $ 0.18 $ 501 $ 0.41
-
-
T
1,215
$ 1
1,230
$ 1
I
79
(3)
14
T
T
0.06
EA
-
0.01
(1,301) (1.06)
50 0.05
$ 636 $0.52
1,226
$
1,232
$
-
T
I
85
T
0.07
(2)
15 0.01
I
I
Q2'21
$710 $ 0.58
1
1,231
$
1,233
$
I
I
I
(2)
10
I
83 0.06
T
0.01
I
Q3'21
1,232
$
1,232
$ -
$923 $0.75 $974 $0.80
I
(60)| (0.05)
99
(2)
0.08
0.01
Q4'21
1,230
$ -
1,230
$
(4)
-
9
112 0.09
I
I
I
I
(25)| (0.03)
(24) (0.02)
(75)| (0.06)
31 0.03
$ 642 $0.52 $ 778 $ 0.63 $ 893 $ 0.73 $ 1,122 $ 0.92
AMD
I
(1) Q1'20 and Q2'20 GAAP diluted EPS calculation includes 31 million shares related to the assumed conversion of the Company's 2026 Convertible Notes and the associated $4 million and $3 million interest
expense, respectively, add-back to net income under the "if converted" method. Q3'20 and Q4'20 GAAP diluted EPS calculation includes 11 million and 3 million shares, respectively, related to the assumed
conversion of the Company's 2026 Convertible Notes and the associated $1 million and $0 million interest expense, respectively, add-back to net income under the "if converted" method. The 20 million (15
million weighted-average), 8 million shares (6 million weighted-average) and 3 million shares (2 million weighted-average) issued in exchange for $165 million, $60 million and $24 million of convertible debt
in Q3'20, Q4'20 and Q1'21, respectively, were not included as their inclusion would have been anti-dilutive.
I
I
1,222
$ -
1,222
$ -View entire presentation