Sonos Results Presentation Deck
Q3 Financial Summary
Q3 Revenue
$378.7
CC: +45.1%
Reported:
+51.9%
3Q21
Americas (59% of sales): 48.0% y/y
EMEA (33% of sales): 50.6% y/y
APAC (8% of sales): 100.5% y/y
Q3 Adjusted EBITDA
$46.7
12.3% margin
3Q21
$371.8
CC: +2.2%
Reported: -1.8%
3Q22
Americas (63% of sales): 3.9% y/y
EMEA (30% of sales): -10.7% y/y
APAC (7% of sales): -7.1% y/y
$42.1
11.3% margin
3Q22
$373.4
CC: +0.3%
Reported: +0.4%
3Q23
Americas (67% of sales): 8.3% y/y
EMEA (28% of sales): -6.5% y/y
APAC (4% of sales): -38.4% y/y
$34.3
9.2% margin
3Q23
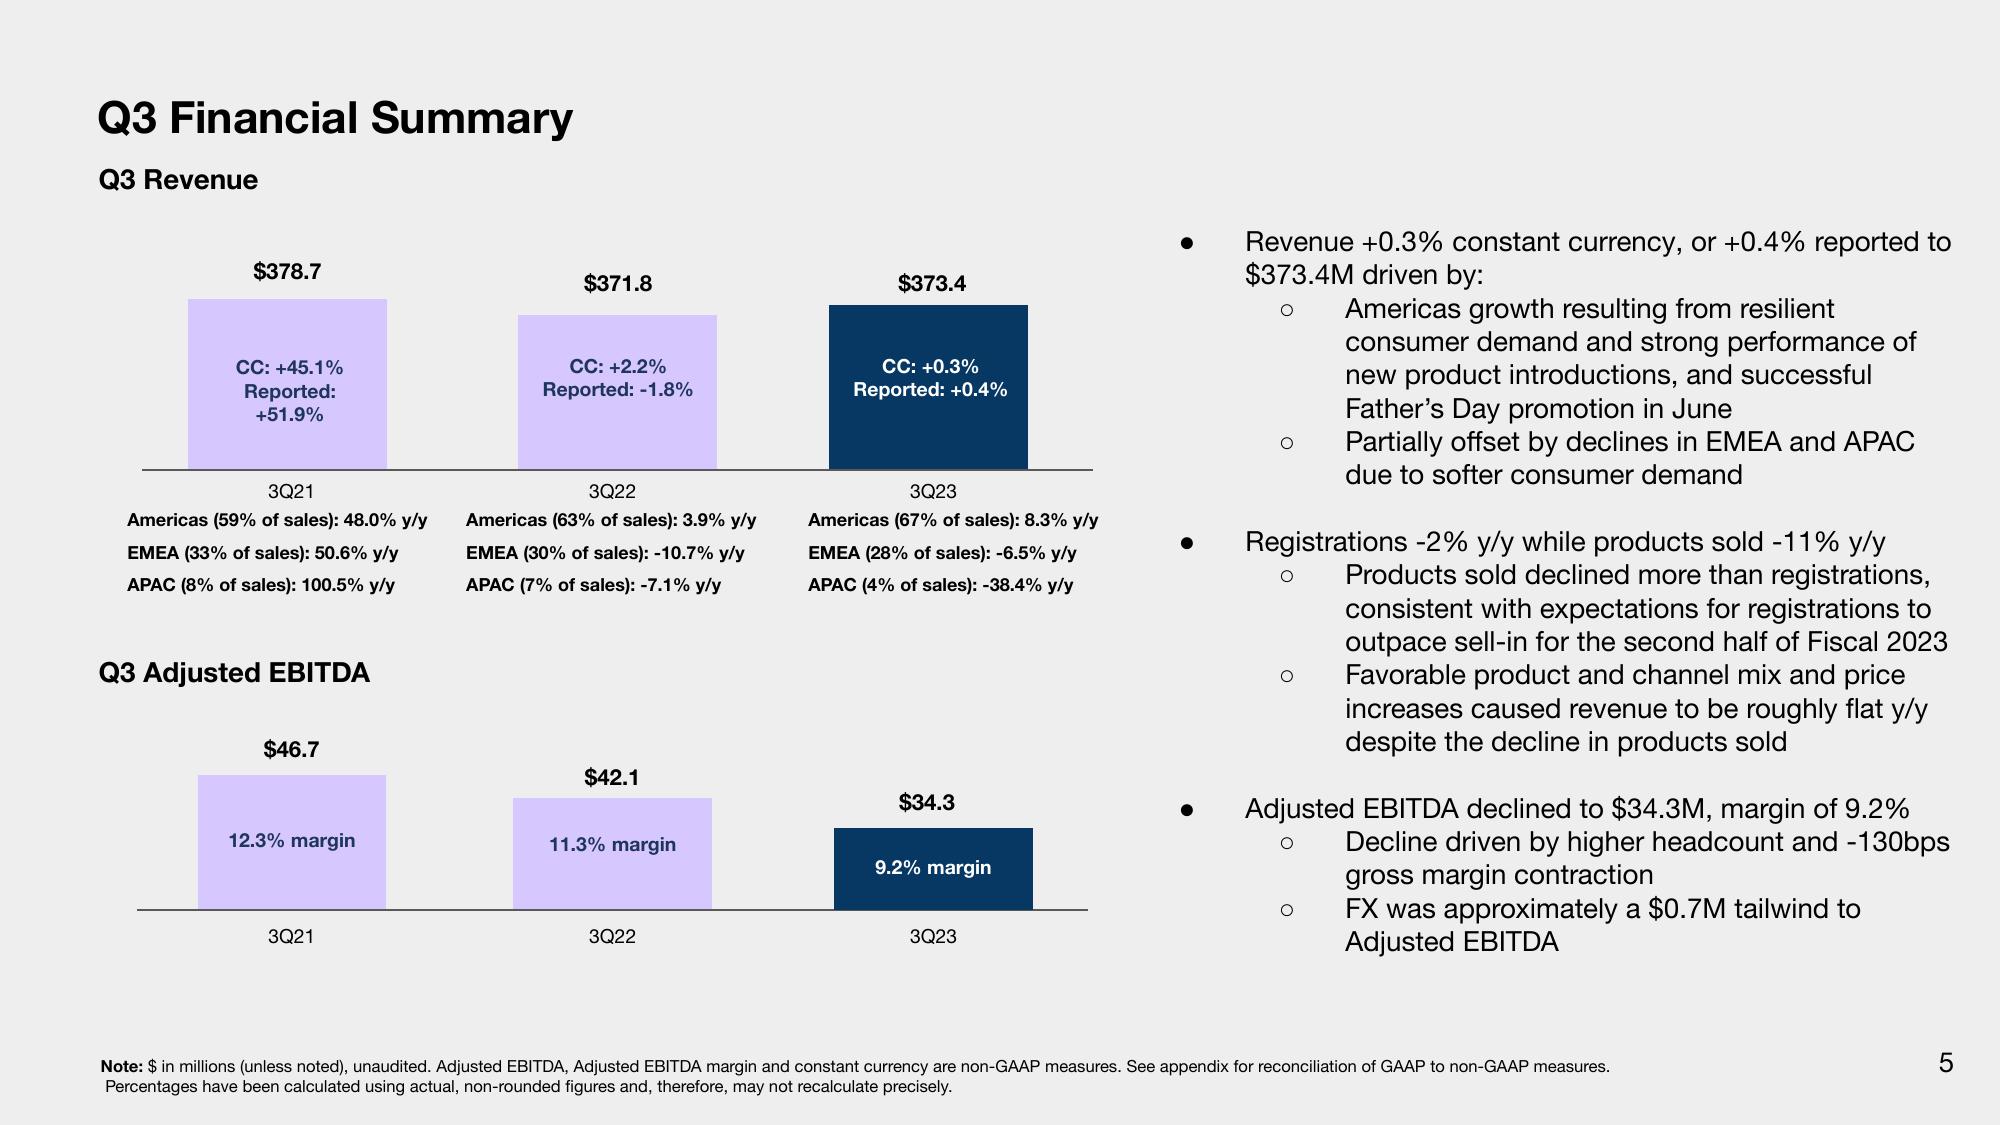
Revenue +0.3% constant currency, or +0.4% reported to
$373.4M driven by:
Americas growth resulting from resilient
consumer demand and strong performance of
new product introductions, and successful
Father's Day promotion in June
Partially offset by declines in EMEA and APAC
due to softer consumer demand
O
Registrations -2% y/y while products sold -11% y/y
Products sold declined more than registrations,
consistent with expectations for registrations to
outpace sell-in for the second half of Fiscal 2023
Favorable product and channel mix and price
increases caused revenue to be roughly flat y/y
despite the decline in products sold
O
Adjusted EBITDA declined to $34.3M, margin of 9.2%
Decline driven by higher headcount and -130bps
gross margin contra tion
O
FX was approximately a $0.7M tailwind to
Adjusted EBITDA
Note: $ in millions (unless noted), unaudited. Adjusted EBITDA, Adjusted EBITDA margin and constant currency are non-GAAP measures. See appendix for reconciliation of GAAP to non-GAAP measures.
Percentages have been calculated using actual, non-rounded figures and, therefore, may not recalculate precisely.
5View entire presentation