Grove Results Presentation Deck
Q3 Fiscal 2022 • Financial Highlights
$400
$300
$200
$100
$0
$233
2019
NET REVENUE ($MM)
$364
2020
$384
2021
$100
$75
$50
$25
$0
$95
Q3-2021
$78
Q3-2022
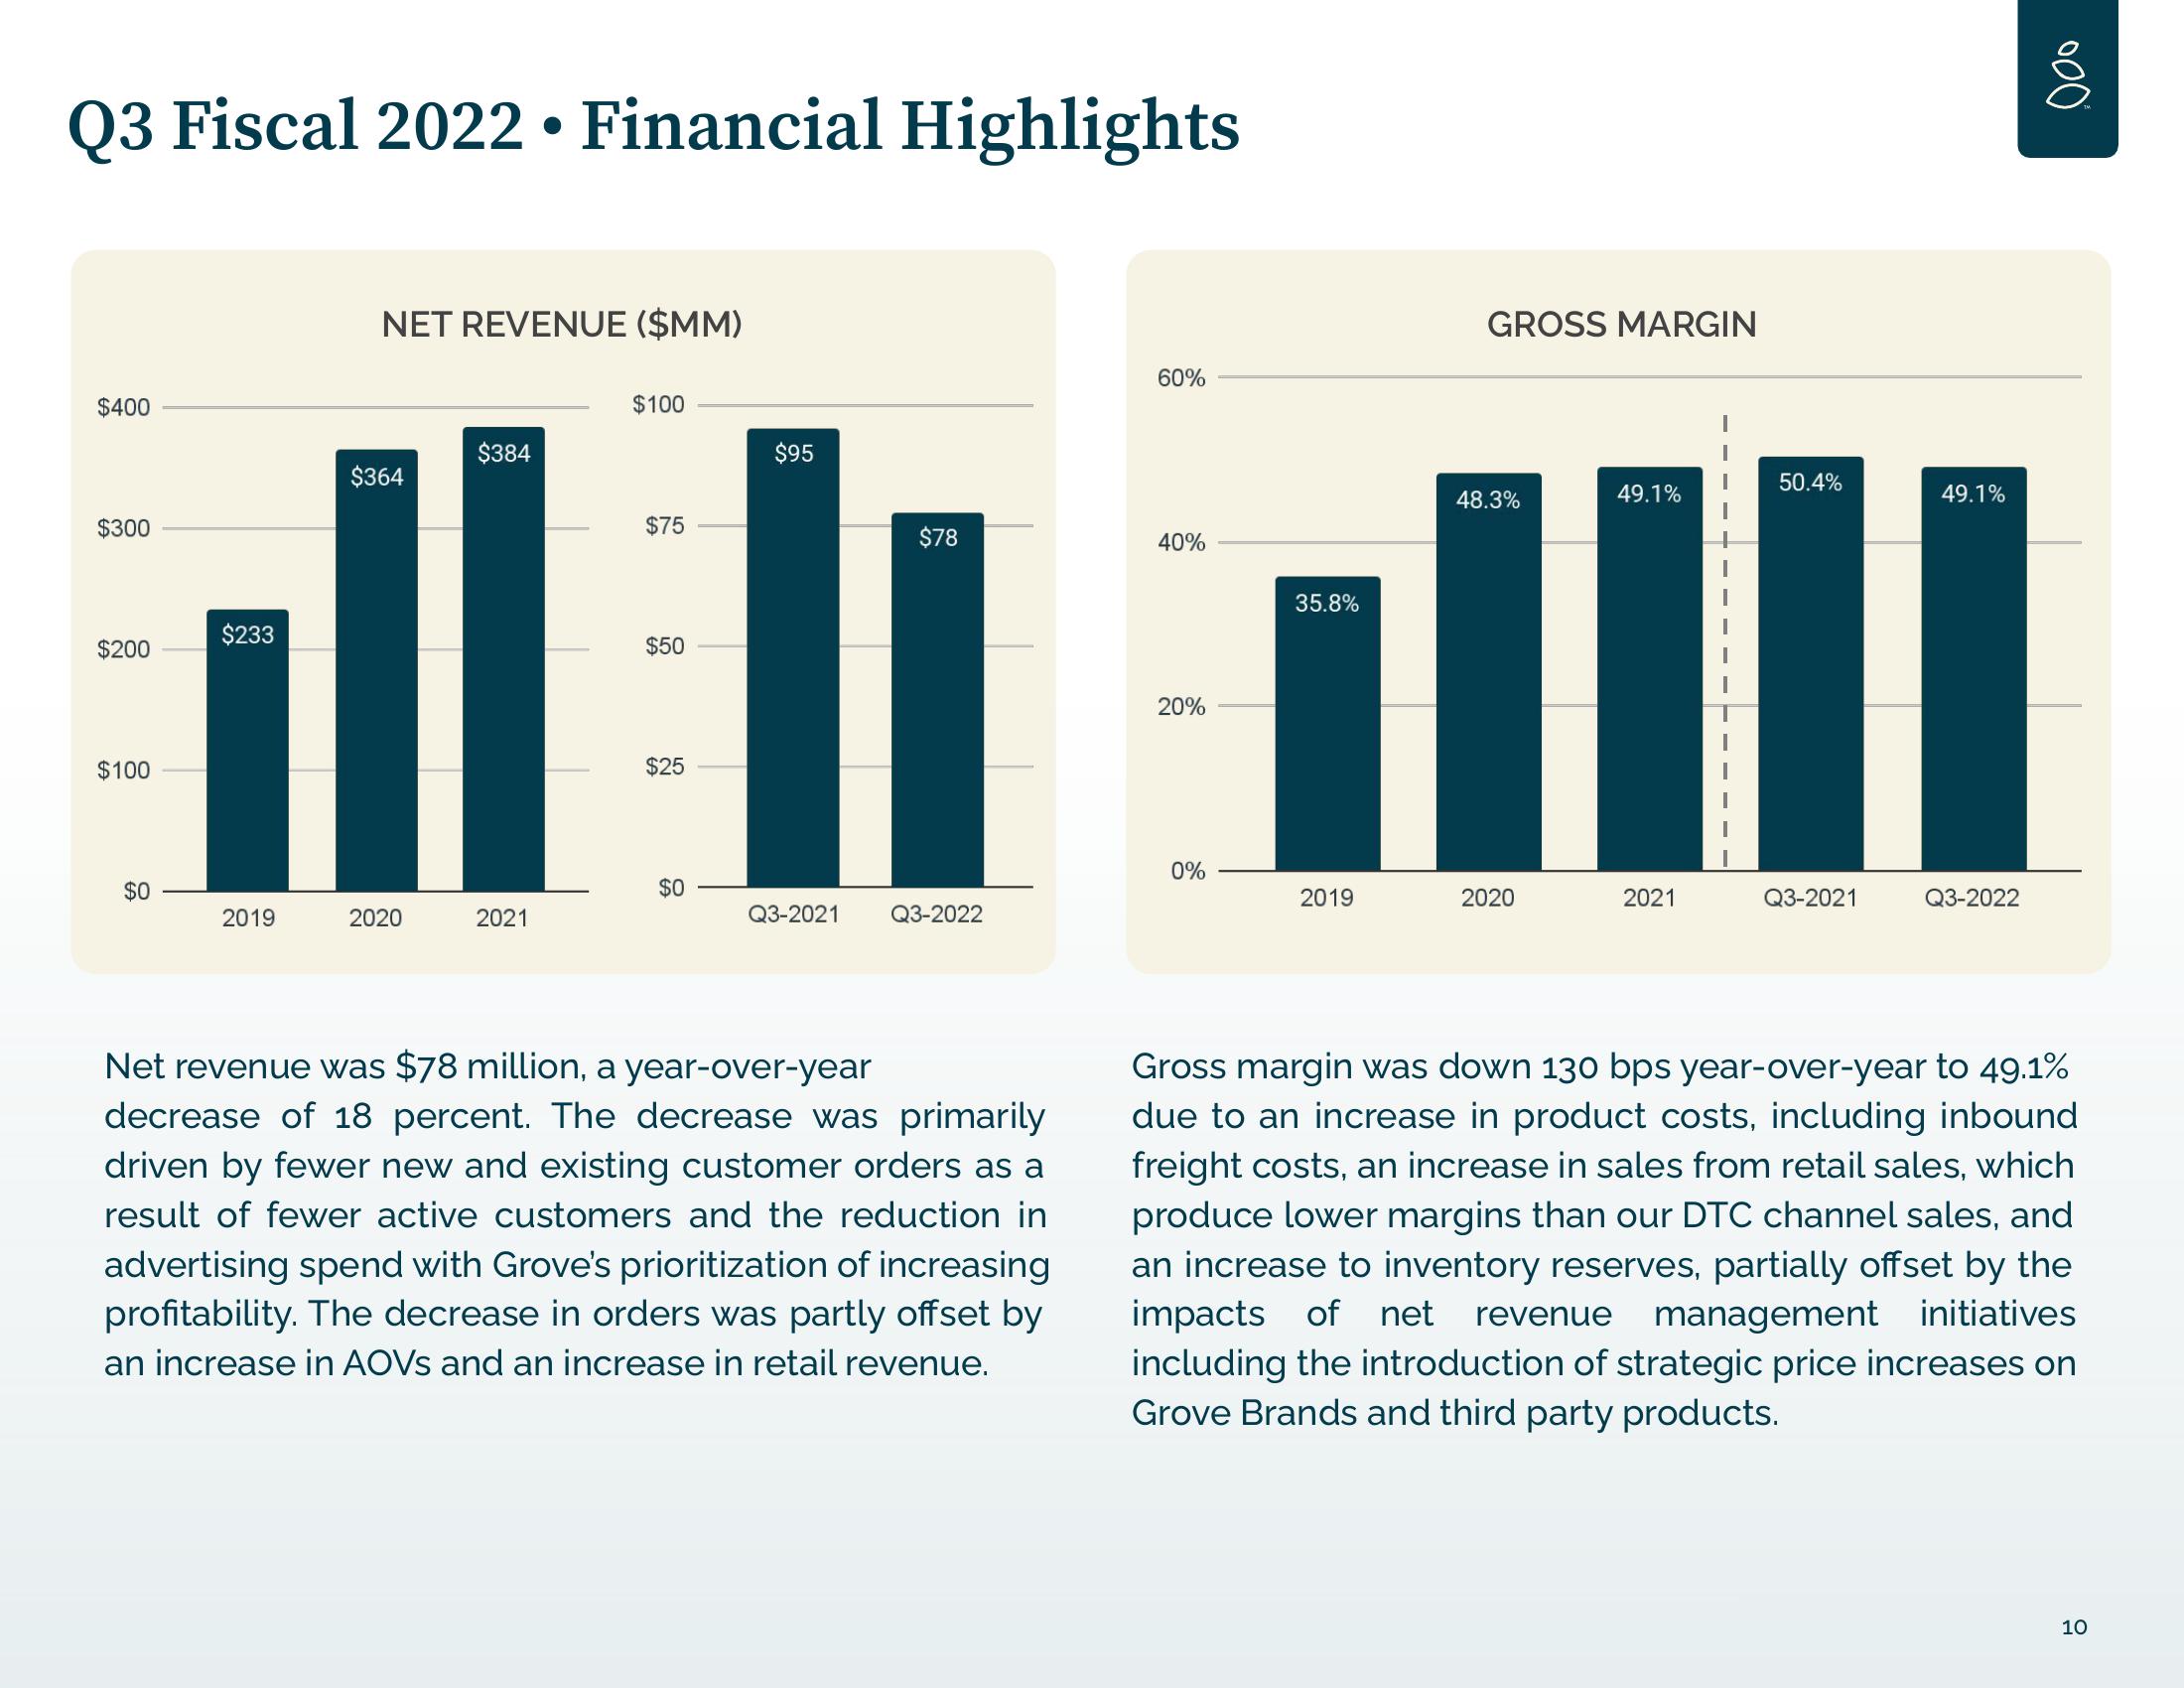
Net revenue was $78 million, a year-over-year
decrease of 18 percent. The decrease was primarily
driven by fewer new and existing customer orders as a
result of fewer active customers and the reduction in
advertising spend with Grove's prioritization of increasing
profitability. The decrease in orders was partly offset by
an increase in AOVS and an increase in retail revenue.
60%
40%
20%
0%
35.8%
2019
GROSS MARGIN
48.3%
2020
49.1%
2021
50.4%
Q3-2021
49.1%
Q3-2022
ooo
Gross margin was down 130 bps year-over-year to 49.1%
due to an increase in product costs, including inbound
freight costs, an increase in sales from retail sales, which
produce lower margins than our DTC channel sales, and
an increase to inventory reserves, partially offset by the
impacts of net revenue management initiatives
including the introduction of strategic price increases on
Grove Brands and third party products.
10View entire presentation