LionTree Investment Banking Pitch Book
Saturn Trading Update
Summary Trading Valuation (as of 6/13/2016)
(Smm, unless indicated)
Current Share Price @ Market ($)¹
Fully Diluted Shares²
Equity Value
Plus: Debt @ 3/31/16
Less: Cash @ 3/31/16
Less: Market Value of Equity Investments
Enterprise Value
EV / (Management Case)
CY 2016E EBITDA (Pre-SBC)
CY 2017E EBITDA (Pre-SBC)
CY 2016 EBITDA (Post-SBC)
CY 2017E EBITDA (Post-SBC)
Leverage Statistics
Net Debt/2016E EBITDA
Credit Ratings
220
200
180
160
140
120
100
80
60
Period
% of 52-Week High
1-Month
6-Month
1-Year
2-year
6/13/2014
Metric (Smm)
490
543
Recent Stock Price Performance
Saturn Luna
56.0% 51.7%
(5.3%)
(21.0%) (36.5%)
(37.2%) (41.7%)
(9.0%) (21.0%)
12/13/2014
Saturn
460
511
6/13/2015
Luna
Source: Saturn management
Notes:
S&P 500
97.7%
0.7%
2.8%
(1.4%)
Draft Working Materials - Subject to Change
$26.01
103.4
2,687
1,131
(10)
(25)
3,783
Multiple
7.7x
7.0x
8.2x
7.4x
2.3x
BB/Ba2
7.4%
(9.0%)
Research Analyst Price Targets
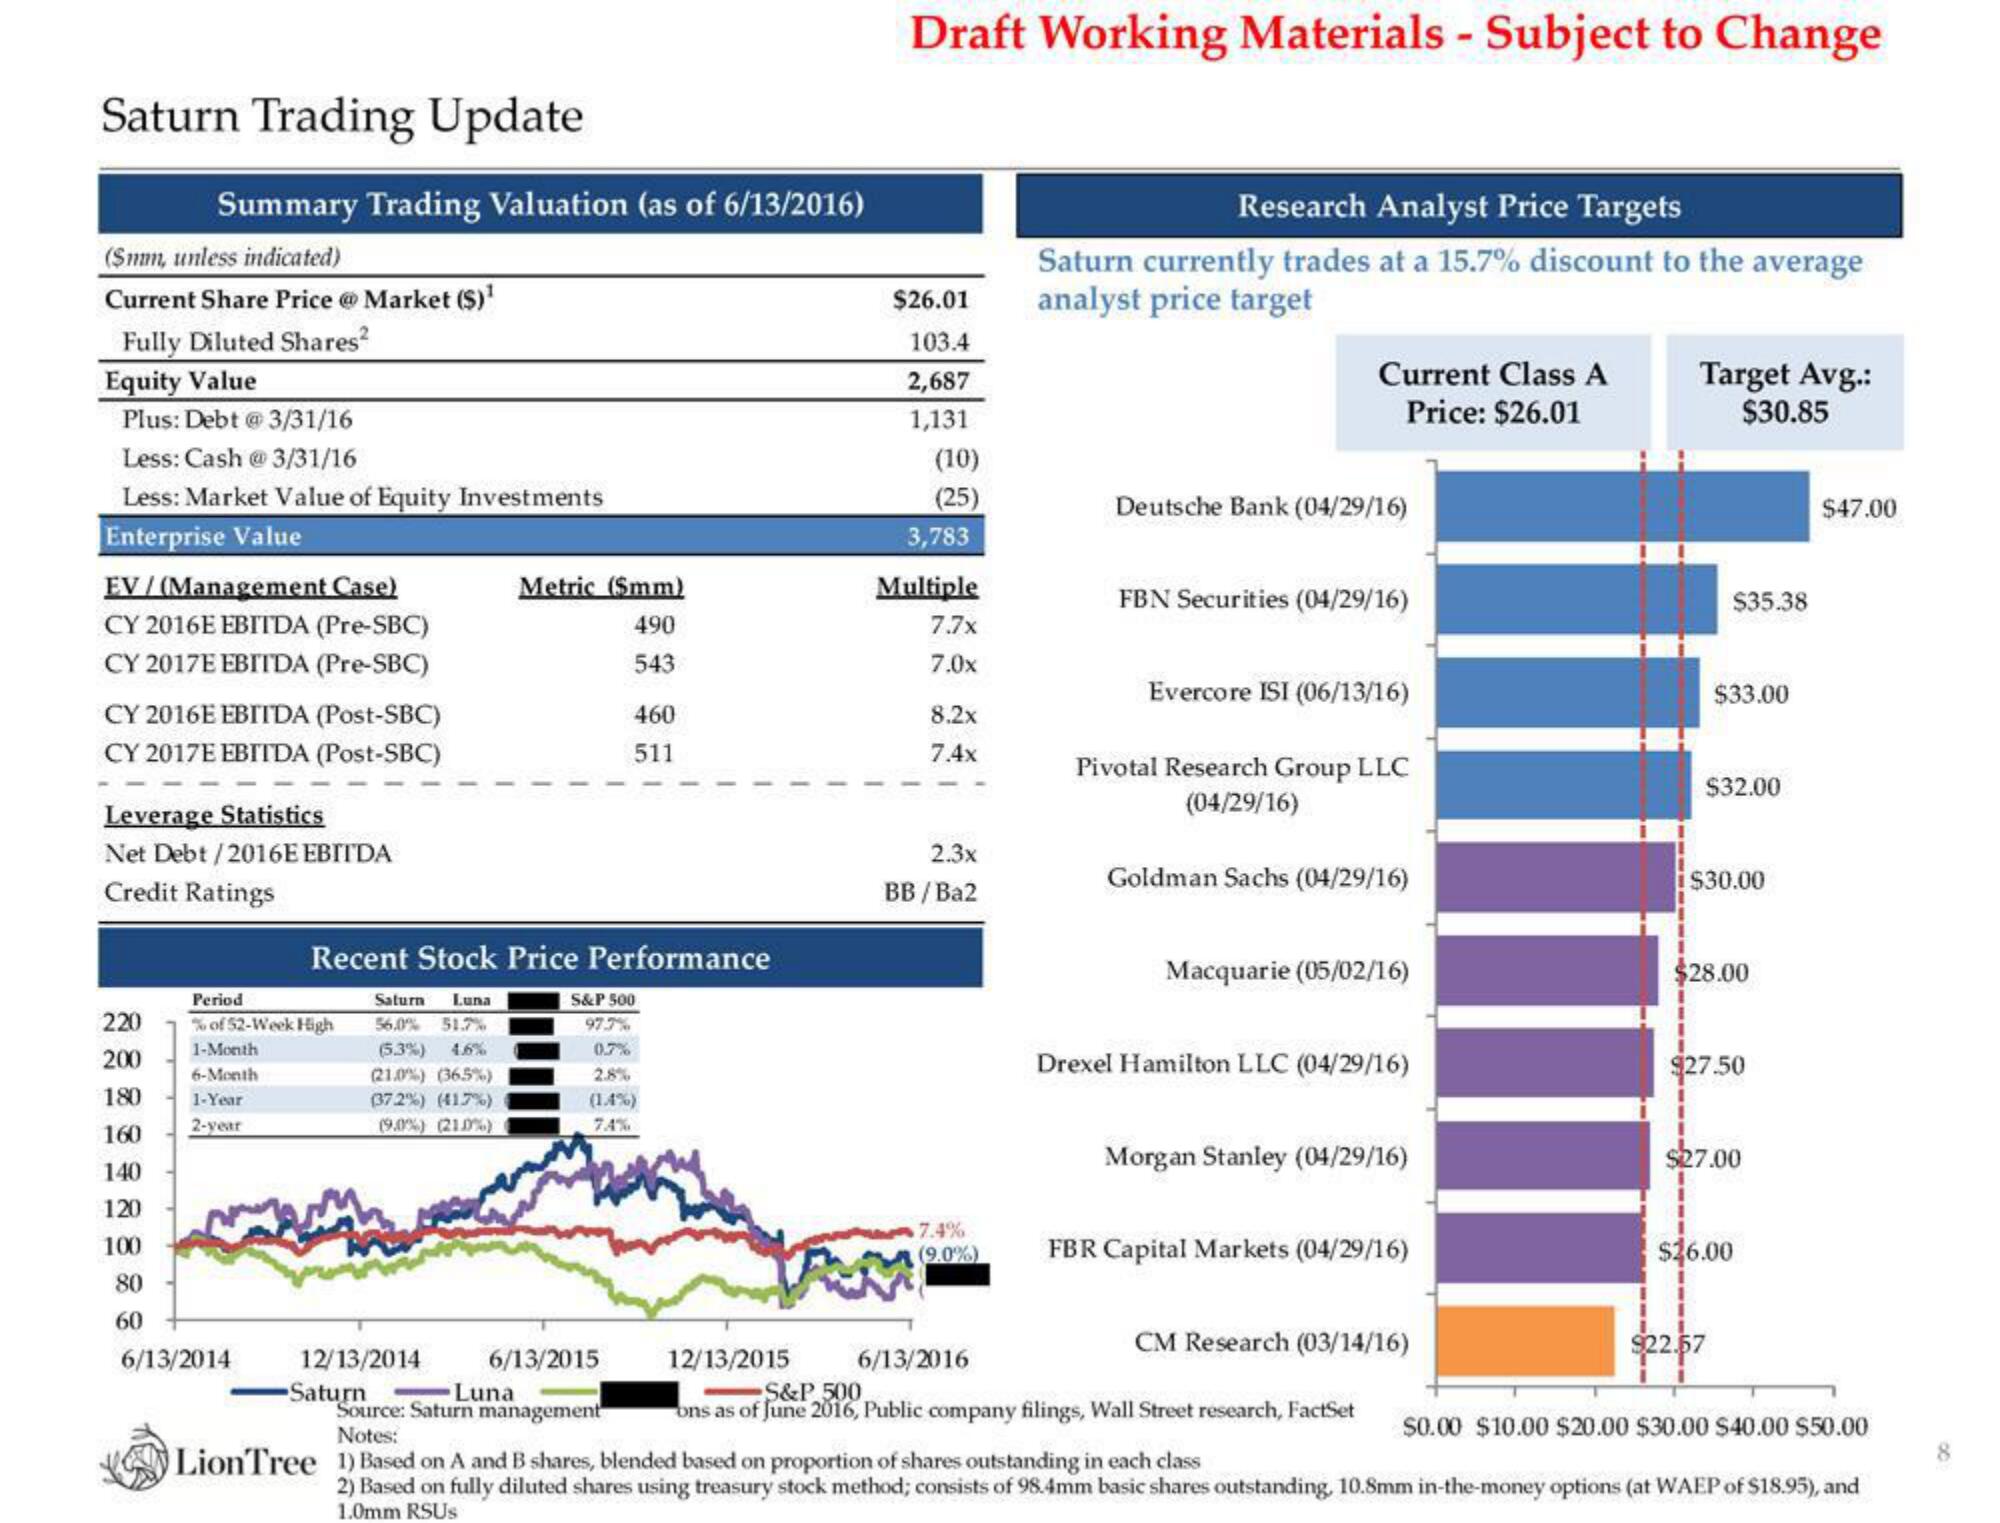
Saturn currently trades at a 15.7% discount to the average
analyst price target
Current Class A
Price: $26.01
Deutsche Bank (04/29/16)
FBN Securities (04/29/16)
Evercore ISI (06/13/16)
Pivotal Research Group LLC
(04/29/16)
Goldman Sachs (04/29/16)
Macquarie (05/02/16)
Drexel Hamilton LLC (04/29/16)
Morgan Stanley (04/29/16)
FBR Capital Markets (04/29/16)
CM Research (03/14/16)
12/13/2015
6/13/2016
S&P 500
ons as of June 2016, Public company filings, Wall Street research, FactSet
Target Avg.:
$30.85
$35.38
$33.00
$32.00
$30.00
$28.00
$27.50
$27.00
$26.00
$47.00
$0.00 $10.00 $20.00 $30.00 $40.00 $50.00
LionTree 1) Based on A and B shares, blended based on proportion of shares outstanding in each class
2) Based on fully diluted shares using treasury stock method; consists of 98.4mm basic shares outstanding, 10.8mm in-the-money options (at WAEP of $18.95), and
1.0mm RSUSView entire presentation