Lyft Investor Presentation Deck
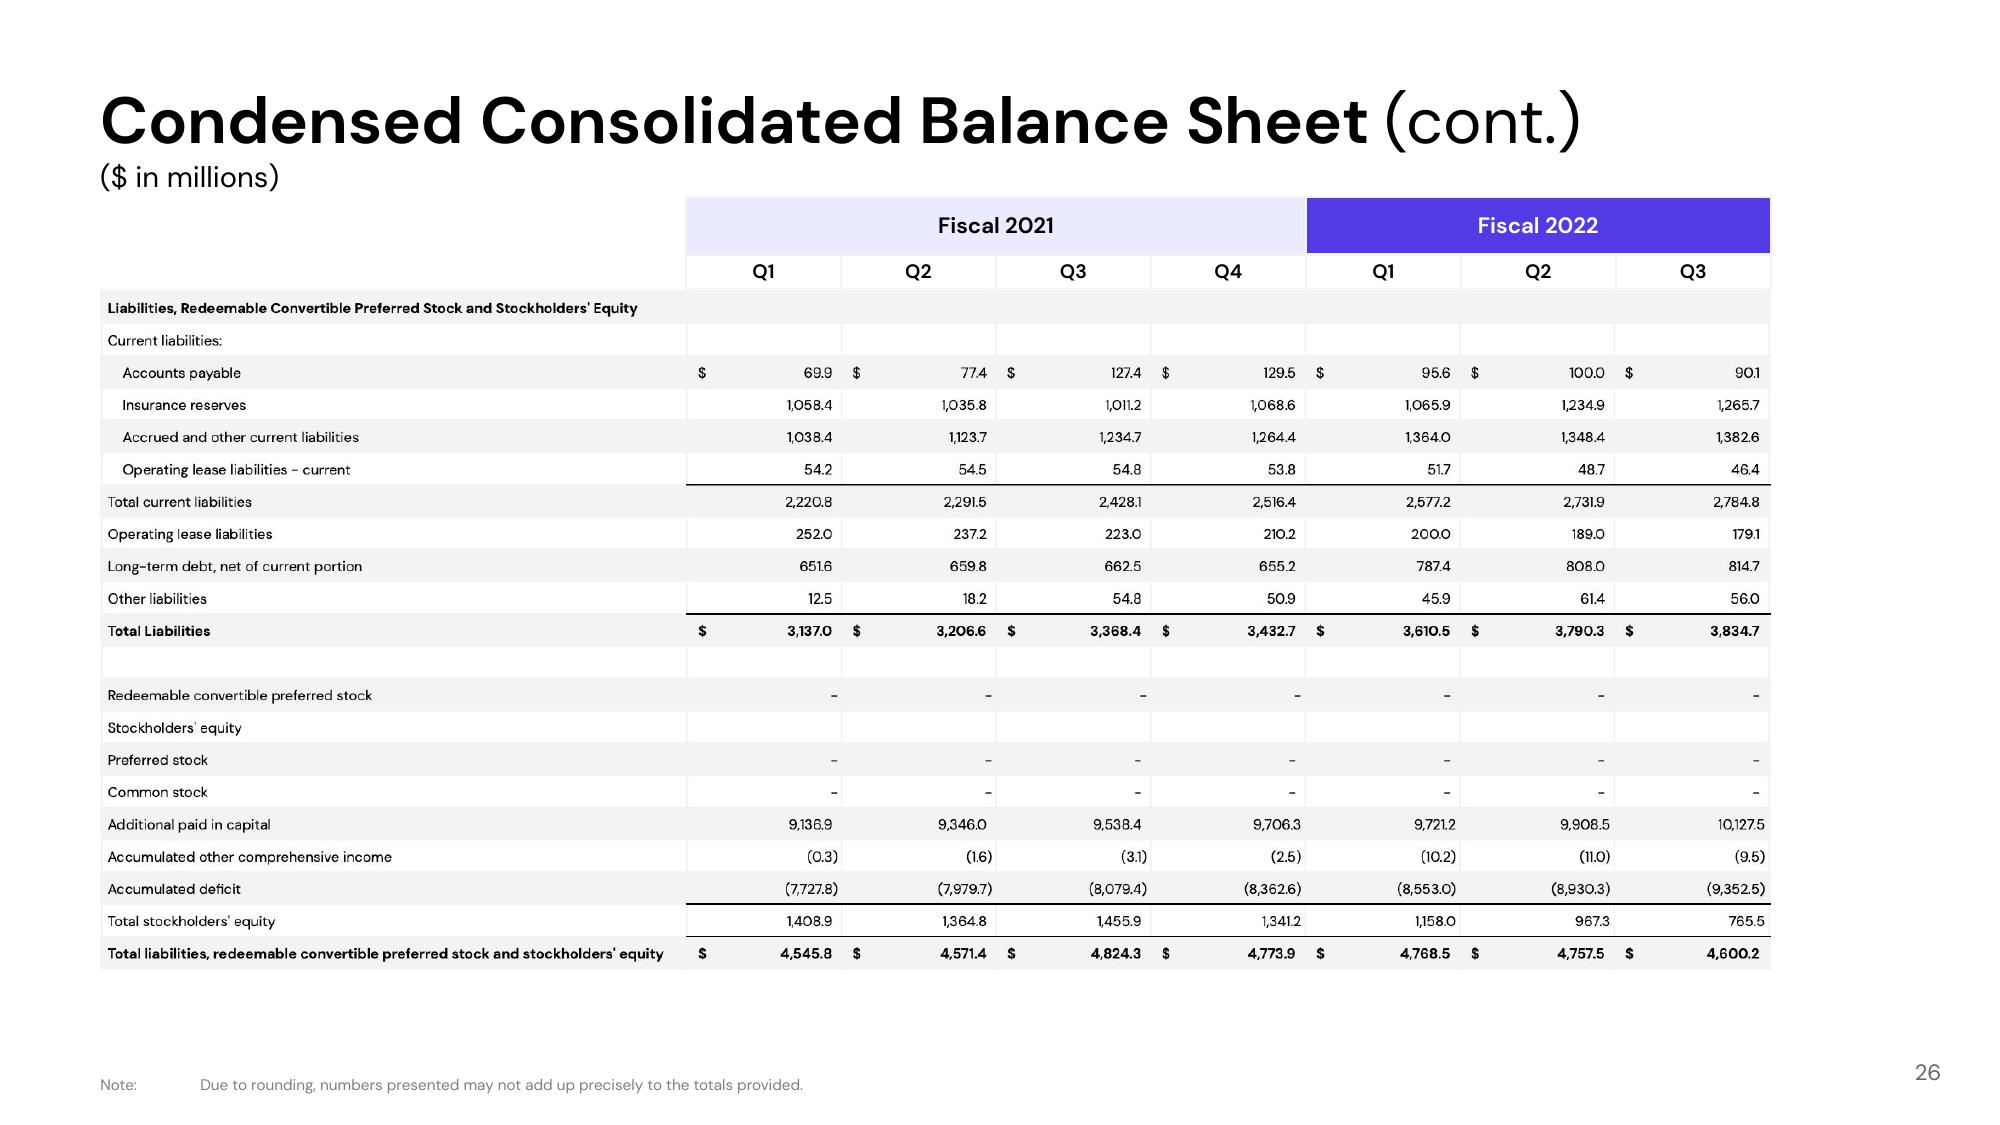
Condensed Consolidated Balance Sheet (cont.)
($ in millions)
Liabilities, Redeemable Convertible Preferred Stock and Stockholders' Equity
Current liabilities:
Accounts payable
Insurance reserves
Accrued and other current liabilities
Operating lease liabilities - current
Total current liabilities
Operating lease liabilities
Long-term debt, net of current portion
Other liabilities.
Total Liabilities
Redeemable convertible preferred stock
Stockholders' equity.
Preferred stock
Common stock
Additional paid in capital
Accumulated other comprehensive income
Accumulated deficit
$
Note:
$
Total stockholders' equity
Total liabilities, redeemable convertible preferred stock and stockholders' equity $
Q1
69.9 $
1,058.4
1038.4
54.2
2,220.8
252.0
651.6
12.5
3,137.0
9,136.9
(0.3)
(7,727.8)
1,408.9
4,545.8
Due to rounding, numbers presented may not add up precisely to the totals provided.
$
$
Q2
Fiscal 2021
774
1,035.8
1,123.7
54.5
2,291.5
237.2
659.8
18.2
3,206.6 $
9,346.0
$
(1.6)
(7,979.7)
1,364.8
4,571.4
$
Q3
127.4 $
1,011.2
1,234.7
54.81
2,428.1
223.0
662.5
54.8
3,368.4 $
9,538.4
(3.1)
(8,079.4)
1,455.9
4,824.3 $
Q4
129.5 $
1,068.6
1,264.4
53.8
2,516.4
210.2
655.2
50.9
3,432.7
9,706.3.
(2.5)
(8,362.6)
1,341.2
4,773.9
$
$
Q1
95.6 $
1,065.9
1,364.0
51.7
2,577.2
200.0
787.4
45.9
Fiscal 2022
3,610.5
$
9,721.2
(10.2)
(8,553.0)
1,158.0
4,768.5 $
Q2
100.0
1,234.9
1,348.4
48.7
2,731.9
189.0
808.0
61.4
3,790.3
9,908.5
(11.0)
(8,930.3)
967.3
4,757.5
$
$
Q3
90.1
1,265.7
1,382.6
46.4
2,784.8
179.1
814.7
56.0
3,834.7
10,127.5
(9.5)
(9,352.5)
765.5
4,600.2
26View entire presentation