Barclays Global Financial Services Conference
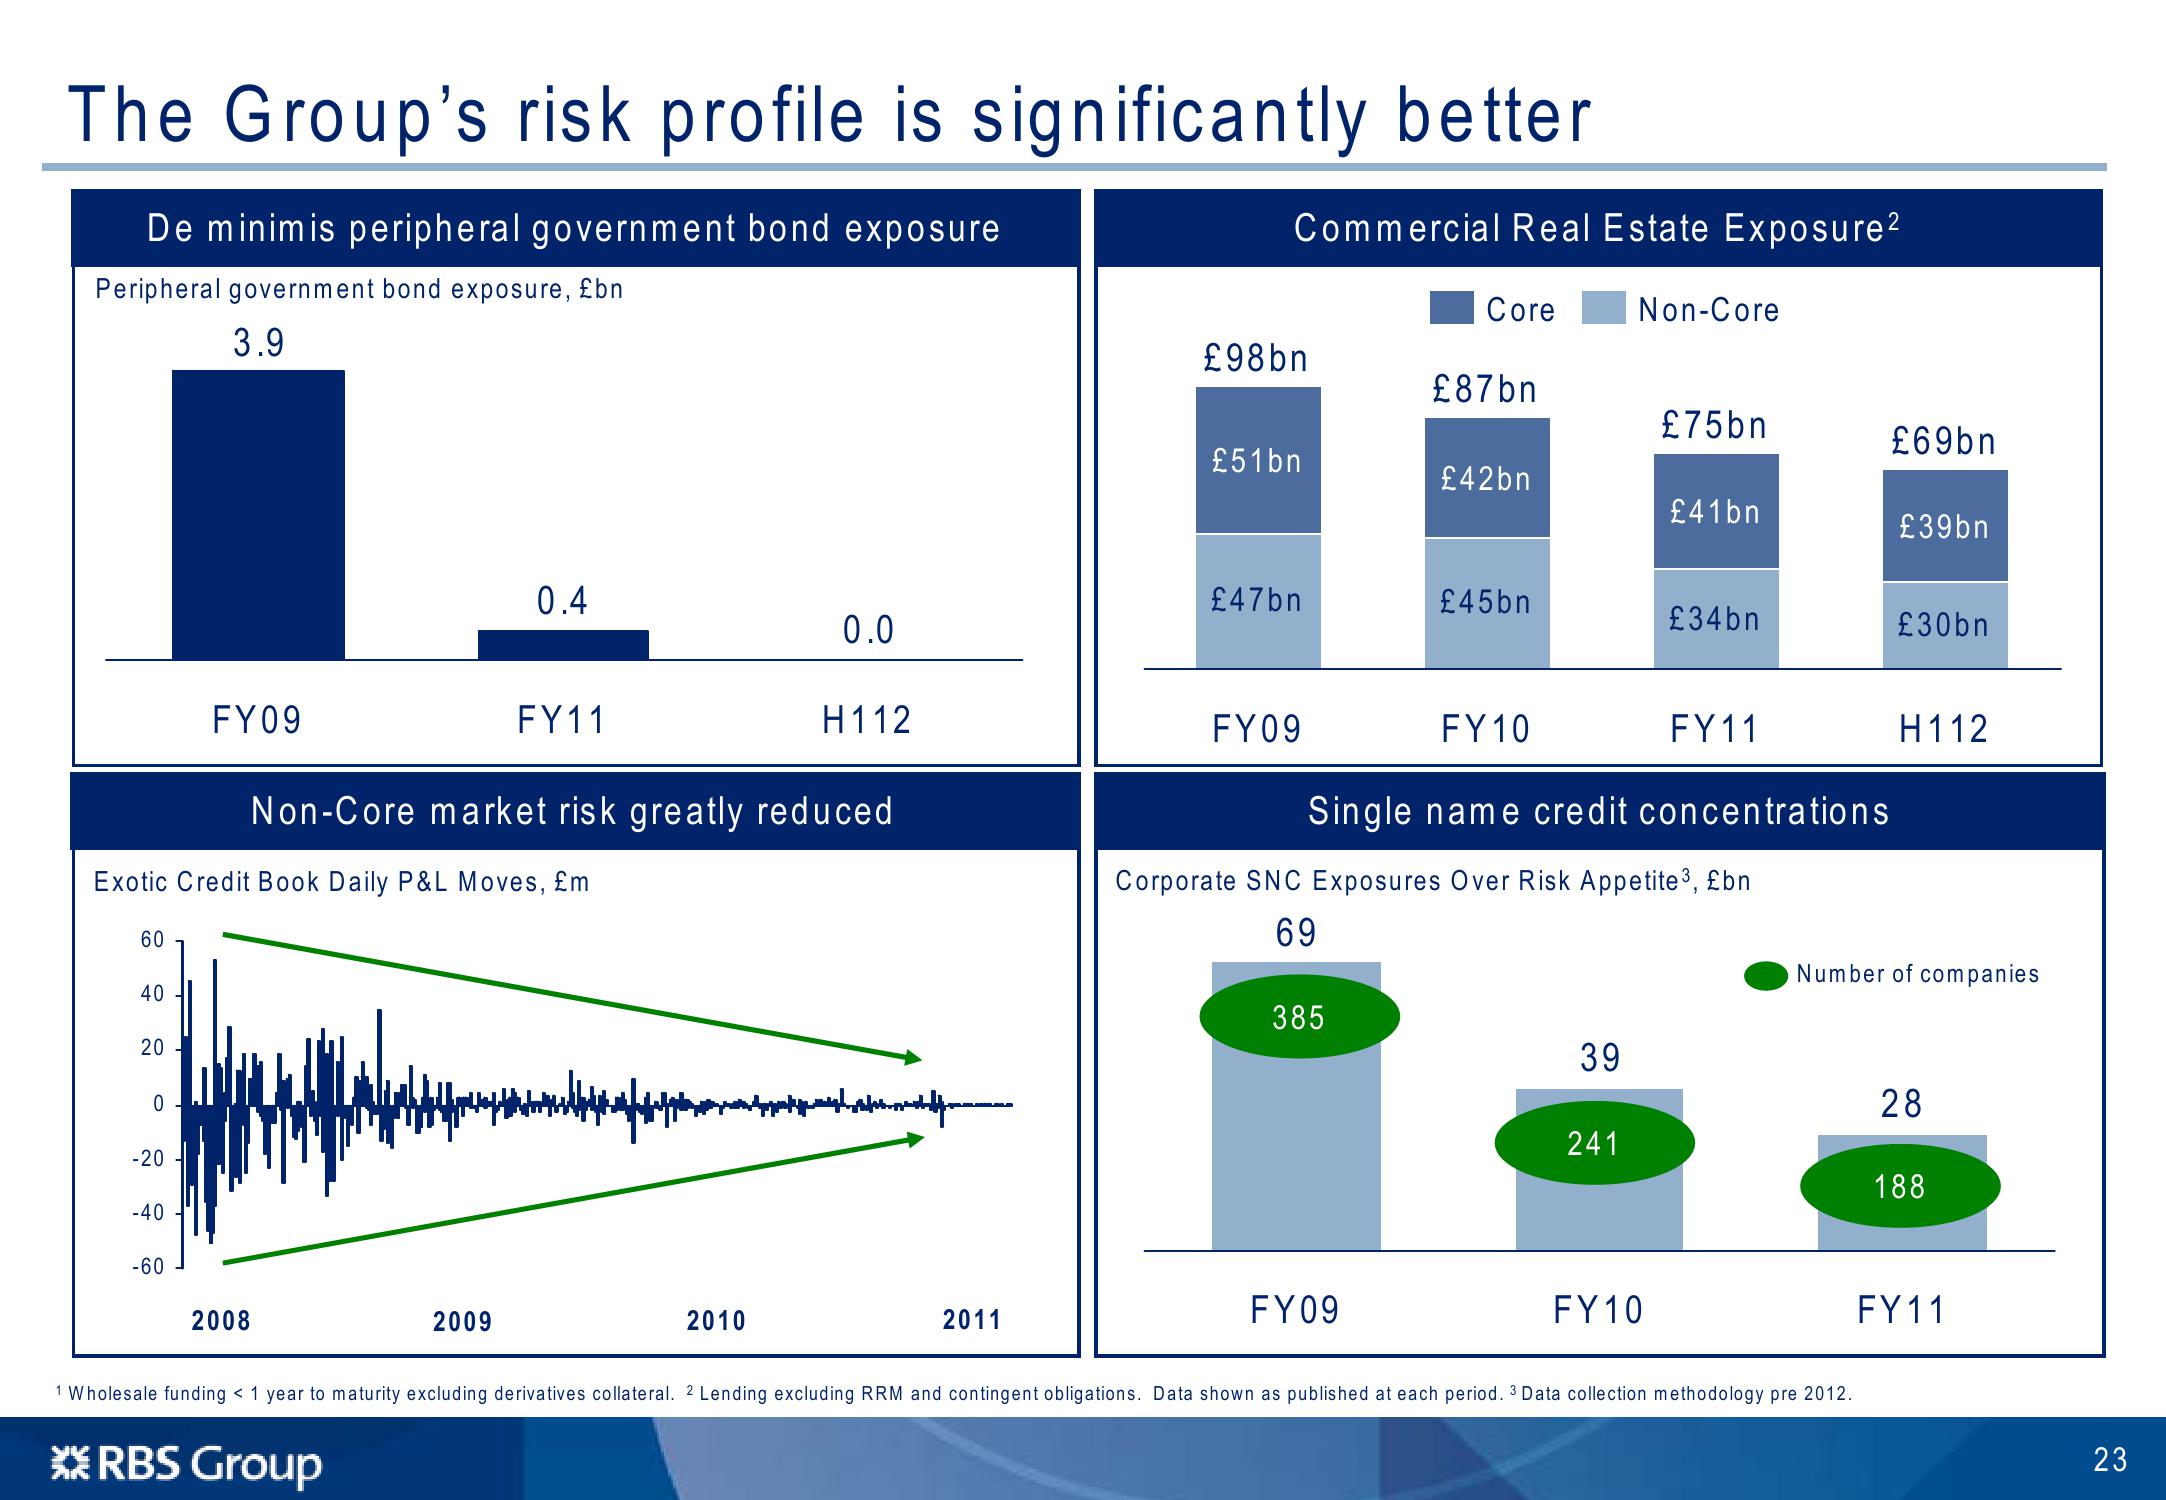
The Group's risk profile is significantly better
De minimis peripheral government bond exposure
Peripheral government bond exposure, £bn
3.9
Commercial Real Estate Exposure²
Non-Core
Core
£98bn
£87bn
£75bn
£69bn
£51bn
£42bn
£41bn
£39bn
0.4
£47bn
£45bn
£34bn
0.0
£30bn
FY09
FY11
H112
FY09
FY10
FY11
H112
Non-Core market risk greatly reduced
Single name credit concentrations
Corporate SNC Exposures Over Risk Appetite ³, £bn
Exotic Credit Book Daily P&L Moves, £m
60
40
20
20
0
-20
-40
-60
2008
2009
2010
2011
69
Number of companies
385
39
28
241
188
FY09
FY10
1 Wholesale funding < 1 year to maturity excluding derivatives collateral. 2 Lending excluding RRM and contingent obligations. Data shown as published at each period. 3 Data collection methodology pre 2012.
*RBS Group
FY11
23
23View entire presentation