Talkspace SPAC Presentation Deck slide image

Talkspace SPAC Presentation Deck

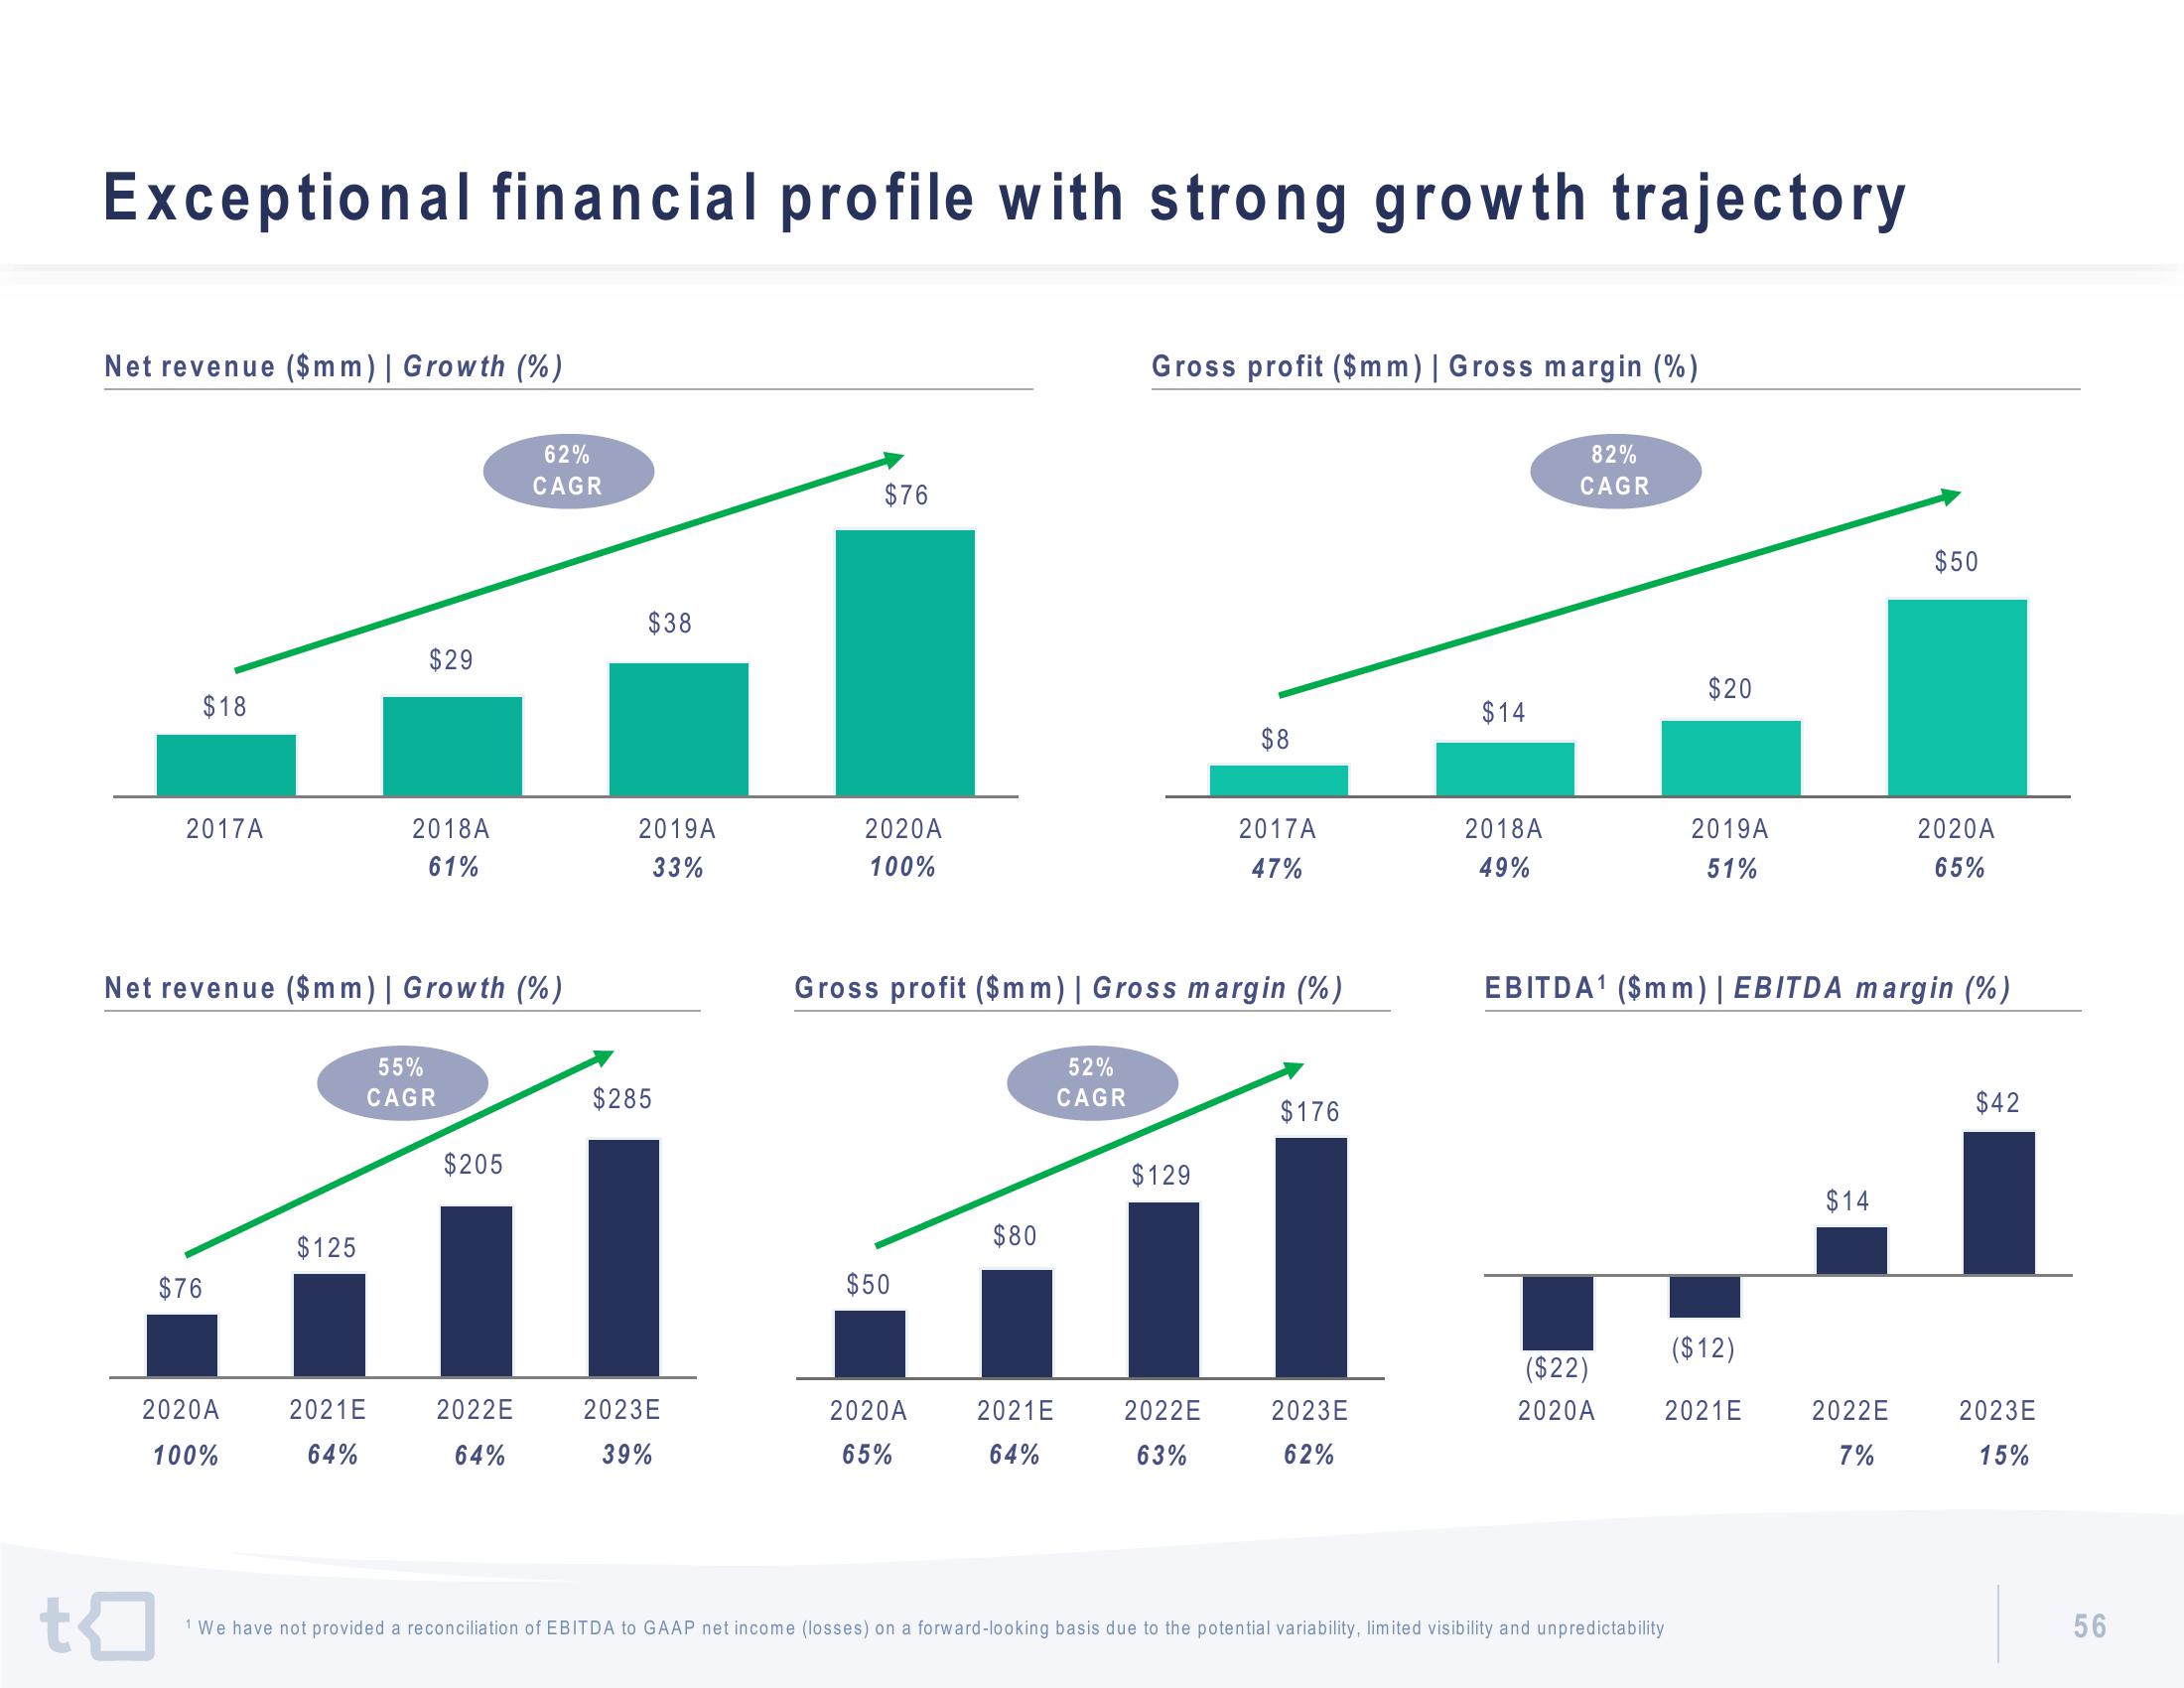
t Exceptional financial profile with strong growth trajectory Net revenue ($mm) | Growth (%) $18 2017A $76 2020A 100% Net revenue ($mm) | Growth (%) $125 $29 2021E 64% 2018A 61% 55% CAGR $205 62% CAGR 2022E 64% $38 2019A 33% $285 2023E 39% $76 2020A 100% $50 2020A 65% Gross profit ($mm) | Gross margin (%) $80 2021E 64% Gross profit ($mm) | Gross margin (%) 52% CAGR $129 $8 2022E 63% 2017A 47% $176 2023E 62% $14 2018A 49% 82% CAGR ($22) 2020A $20 2019A 51% We have not provided a reconciliation of EBITDA to GAAP net income (losses) on a forward-looking basis due to the potential variability, limited visibility and unpredictability EBITDA¹ ($mm) | EBITDA margin (%) ($12) 2021E $14 $50 2022E 7% 2020A 65% $42 2023E 15% 56
View entire presentation