Silicon Valley Bank Results Presentation Deck
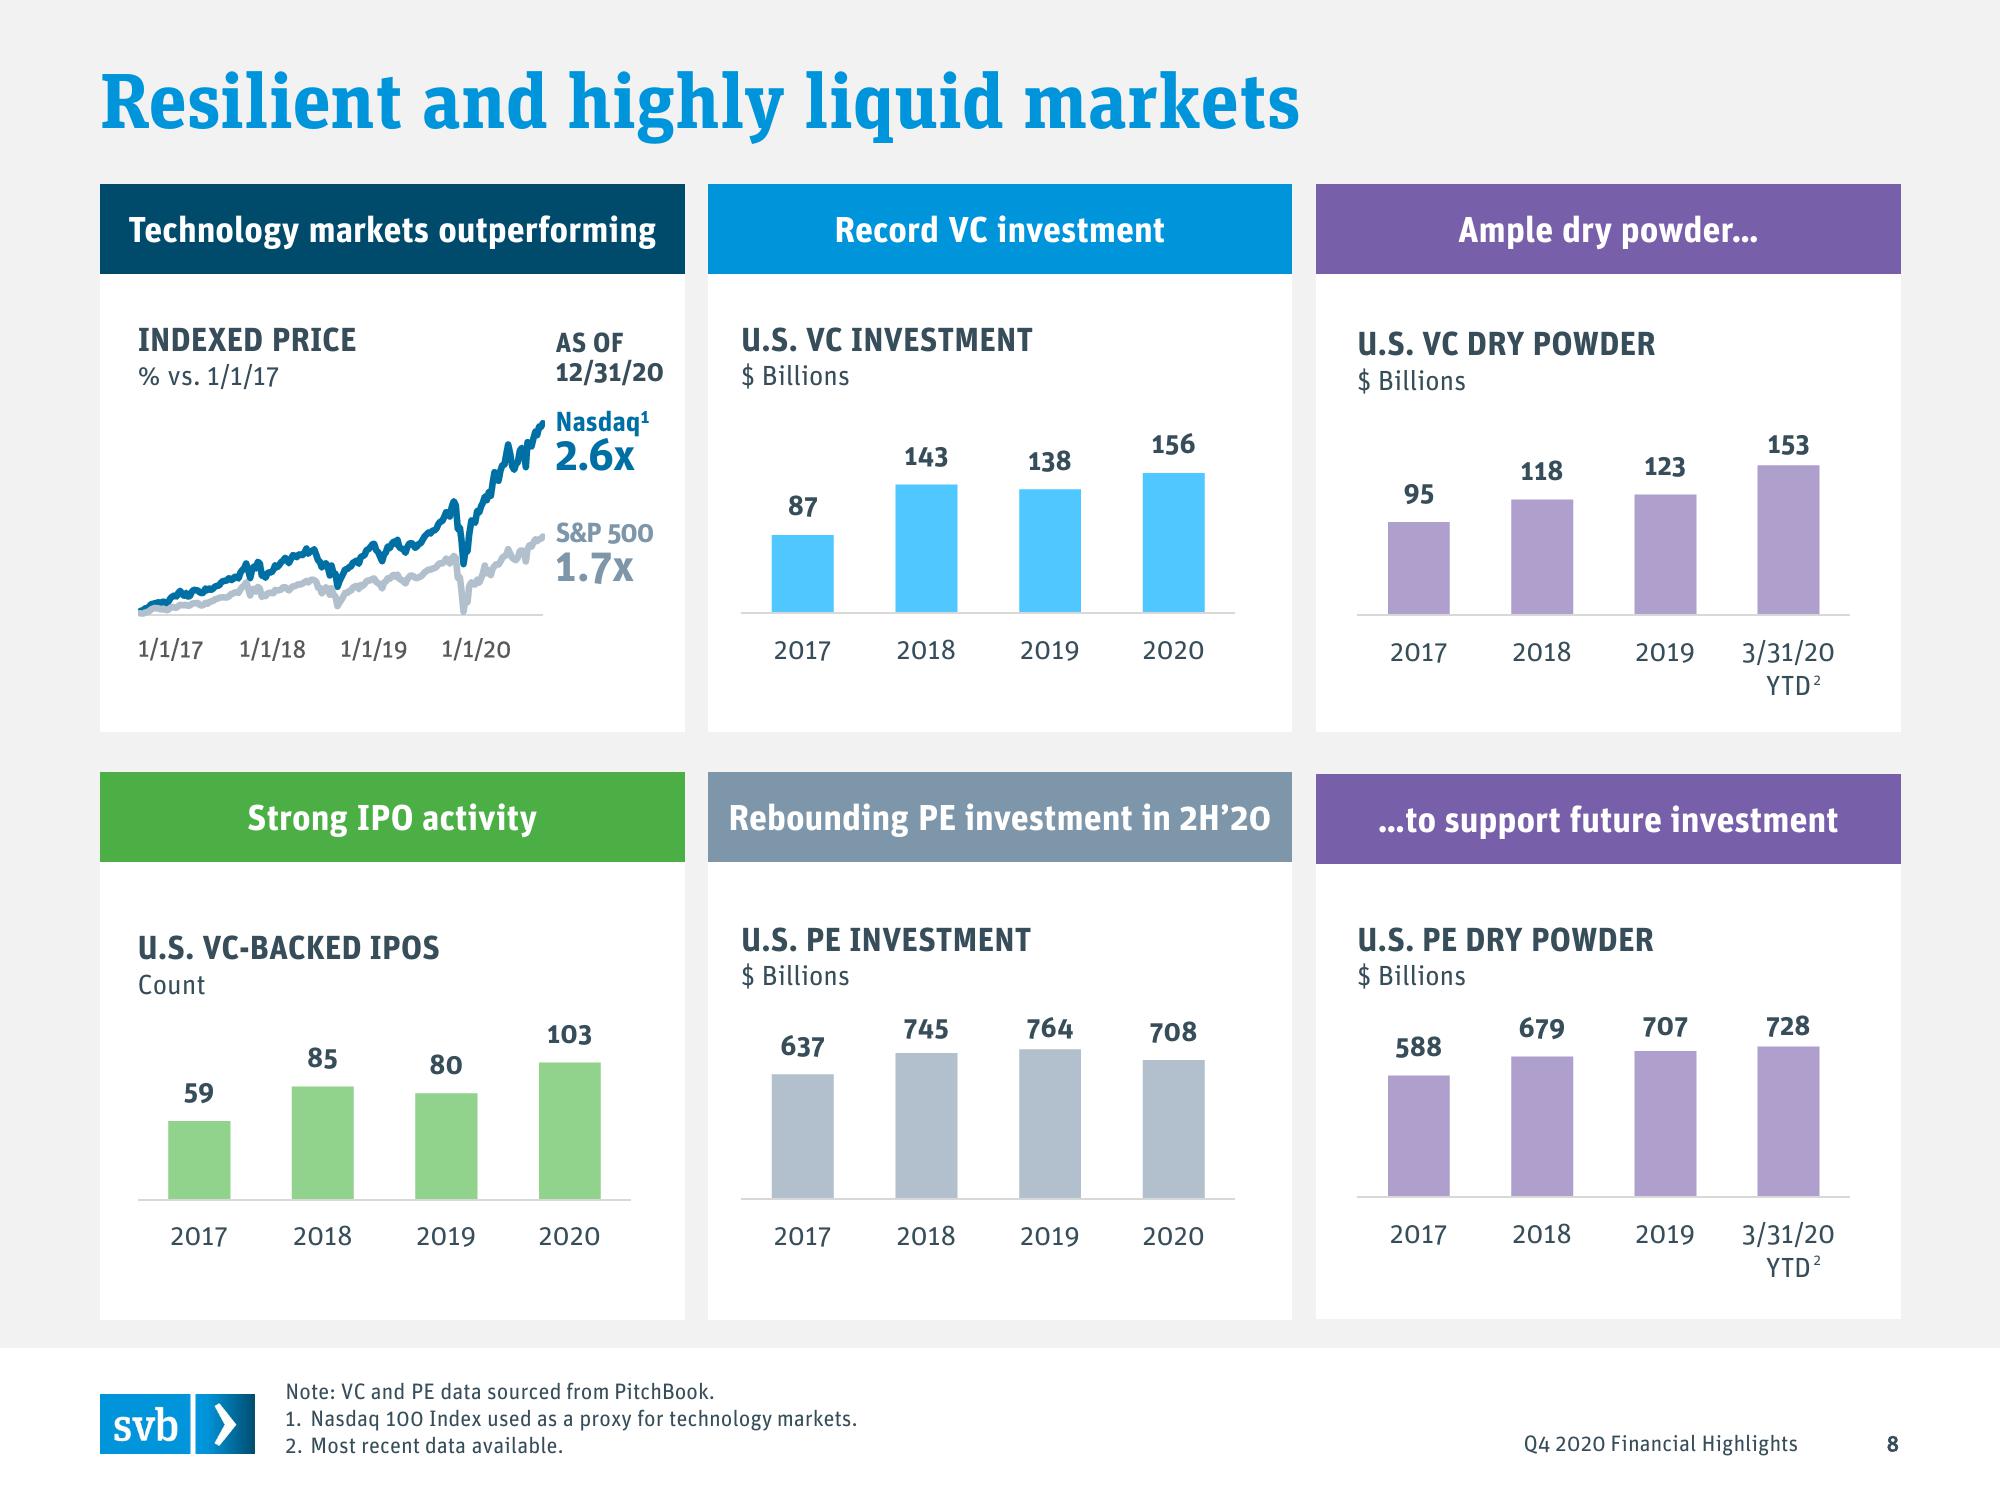
Resilient and highly liquid markets
Technology markets outperforming
INDEXED PRICE
% VS. 1/1/17
1/1/17 1/1/18 1/1/19 1/1/20
U.S. VC-BACKED IPOS
Count
59
2017
Strong IPO activity
svb >
85
2018
80
2019
AS OF
12/31/20
Nasdaq¹
2.6x
S&P 500
1.7x
103
2020
U.S. VC INVESTMENT
$ Billions
87
2017
Record VC investment
637
2017
143
2018
Note: VC and PE data sourced from Pitch Book.
1. Nasdaq 100 Index used as a proxy for technology markets.
2. Most recent data available.
U.S. PE INVESTMENT
$ Billions
Rebounding PE investment in 2H'20
138
745
2019
2018
764
156
2019
2020
708
2020
U.S. VC DRY POWDER
$ Billions
95
2017
Ample dry powder...
588
118
2017
2018
U.S. PE DRY POWDER
$ Billions
123
...to support future investment
679
2019
2018
707
153
2019
3/31/20
YTD²
728
3/31/20
YTD²
Q4 2020 Financial Highlights
8View entire presentation