Axos Financial, Inc. Fixed Income Investor Presentation
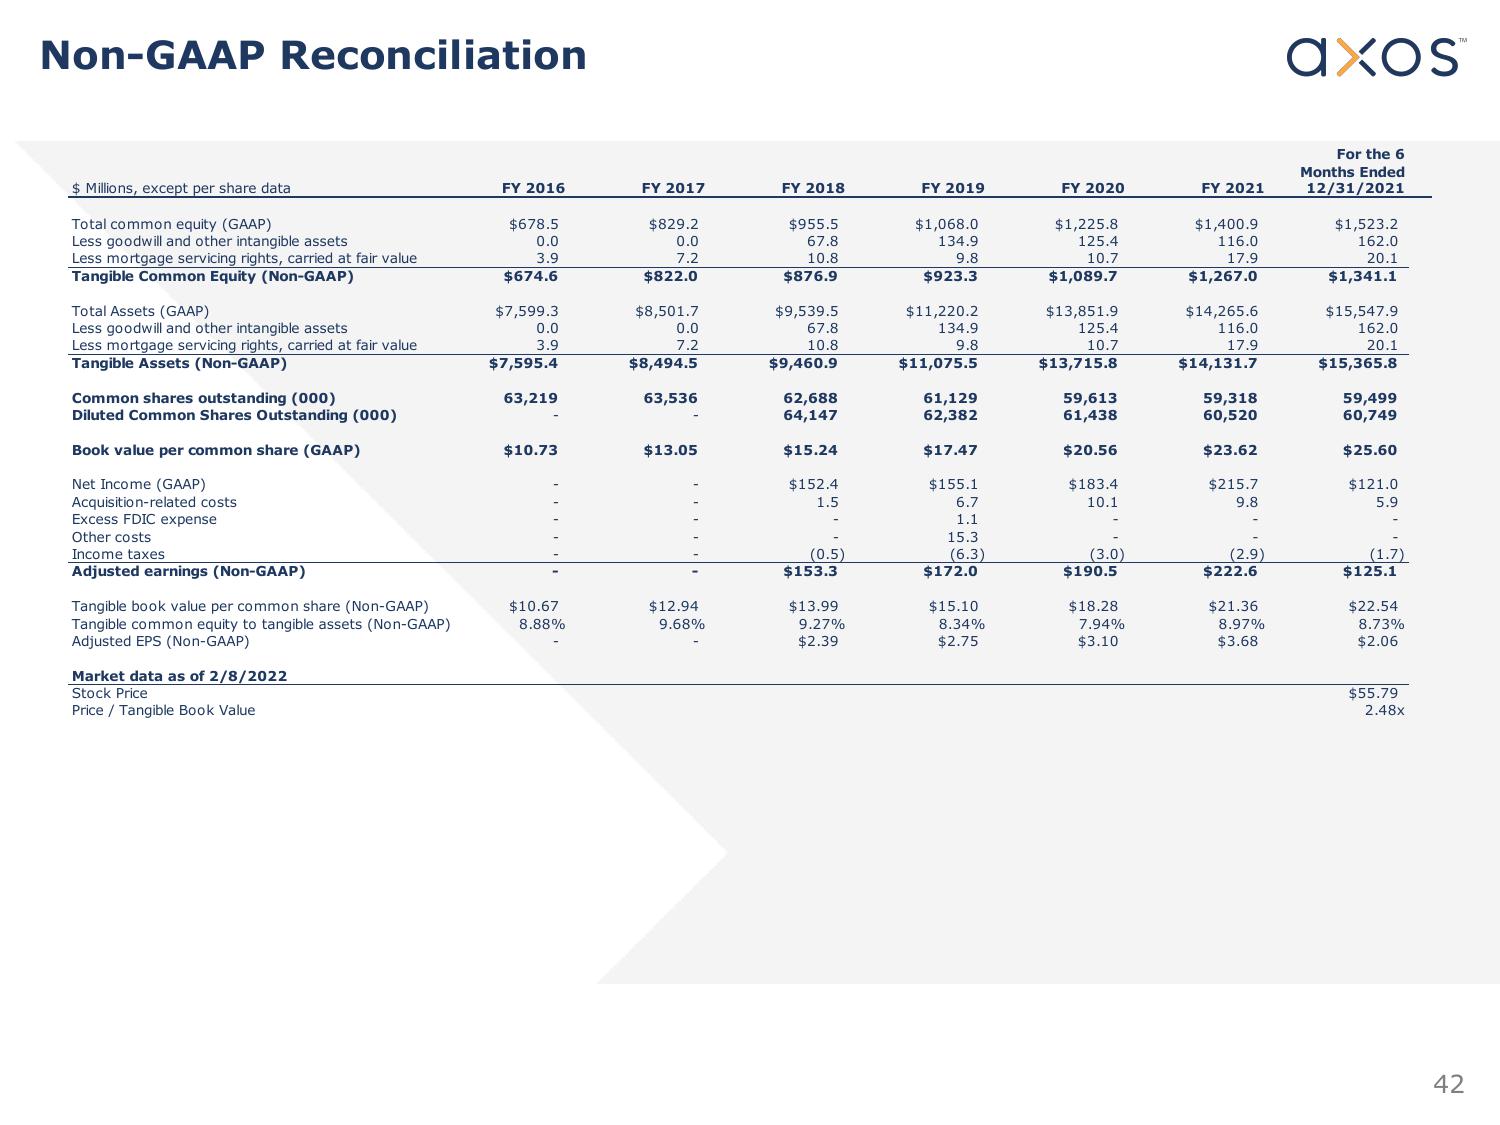
Non-GAAP Reconciliation
$ Millions, except per share data
Total common equity (GAAP)
Less goodwill and other intangible assets
Less mortgage servicing rights, carried at fair value
Tangible Common Equity (Non-GAAP)
Total Assets (GAAP)
Less goodwill and other intangible assets
Less mortgage servicing rights, carried at fair value
Tangible Assets (Non-GAAP)
Common shares outstanding (000)
Diluted Common Shares Outstanding (000)
Book value per common share (GAAP)
Net Income (GAAP)
Acquisition-related costs.
Excess FDIC expense
Other costs
Income taxes
Adjusted earnings (Non-GAAP)
Tangible book value per common share (Non-GAAP)
Tangible common equity to tangible assets (Non-GAAP)
Adjusted EPS (Non-GAAP)
Market data as of 2/8/2022
Stock Price
Price / Tangible Book Value
FY 2016
$678.5
0.0
3.9
$674.6
$7,599.3
0.0
3.9
$7,595.4
63,219
$10.73
$10.67
8.88%
FY 2017
$829.2
0.0
7.2
$822.0
$8,501.7
0.0
7.2
$8,494.5
63,536
$13.05
$12.94
9.68%
FY 2018
$955.5
67.8
10.8
$876.9
$9,539.5
67.8
10.8
$9,460.9
62,688
64,147
$15.24
$152.4
1.5
(0.5)
$153.3
$13.99
9.27%
$2.39
FY 2019
$1,068.0
134.9
9.8
$923.3
$11,220.2
134.9
9.8
$11,075.5
61,129
62,382
$17.47
$155.1
6.7
1.1
15.3
(6.3)
$172.0
$15.10
8.34%
$2.75
FY 2020
$1,225.8
125.4
10.7
$1,089.7
$13,851.9
125.4
10.7
$13,715.8
59,613
61,438
$20.56
$183.4
10.1
(3.0)
$190.5
$18.28
7.94%
$3.10
FY 2021
$1,400.9
116.0
17.9
$1,267.0
$14,265.6
116.0
17.9
$14,131.7
59,318
60,520
$23.62
$215.7
9.8
(2.9)
$222.6
$21.36
8.97%
$3.68
axos
For the 6
Months Ended
12/31/2021
$1,523.2
162.0
20.1
$1,341.1
$15,547.9
162.0
20.1
$15,365.8
59,499
60,749
$25.60
$121.0
5.9
(1.7)
$125.1
$22.54
8.73%
$2.06
$55.79
2.48x
42View entire presentation