Wix Results Presentation Deck
beyond one year. Our long-term deferred revenue balance has increased over
the past several quarters as we have begun to offer packages in durations
longer than one year. The mix of subscription length, as well as the timing of
the sale of subscriptions during a period, influences the amount of revenue we
defer and recognize in a period.
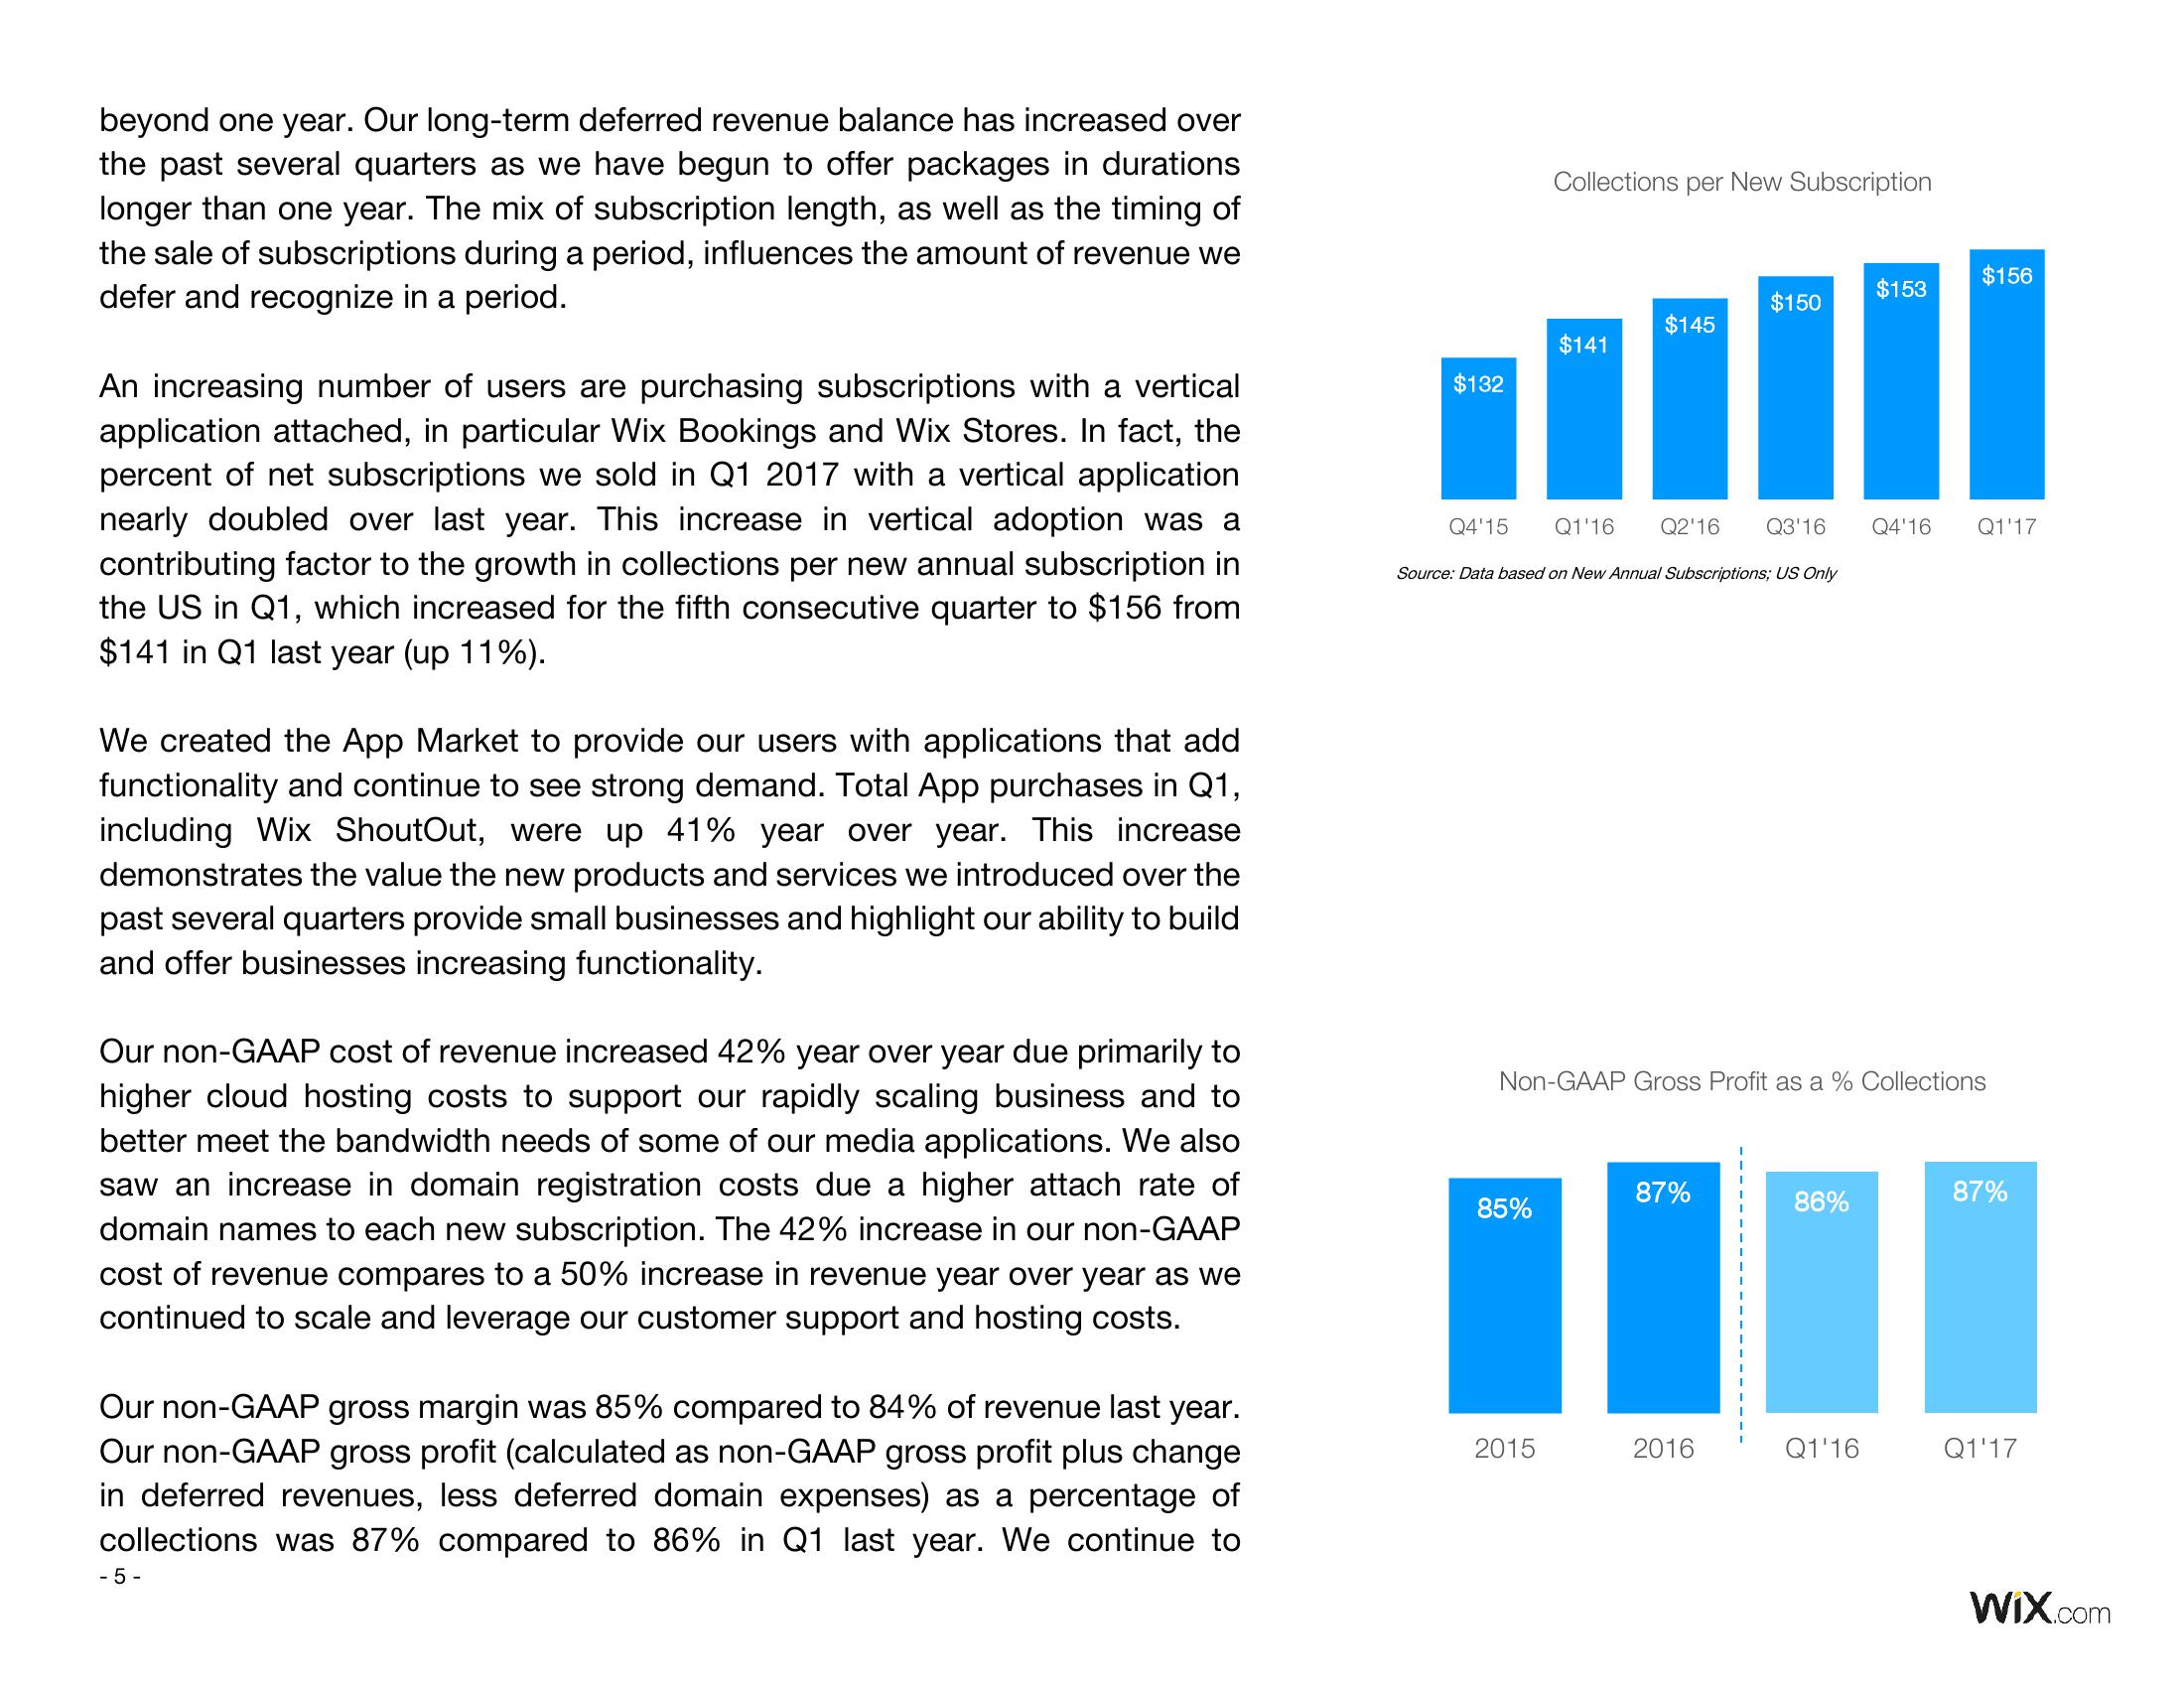
An increasing number of users are purchasing subscriptions with a vertical
application attached, in particular Wix Bookings and Wix Stores. In fact, the
percent of net subscriptions we sold in Q1 2017 with a vertical application
nearly doubled over last year. This increase in vertical adoption was a
contributing factor to the growth in collections per new annual subscription in
the US in Q1, which increased for the fifth consecutive quarter to $156 from
$141 in Q1 last year (up 11%).
We created the App Market to provide our users with applications that add
functionality and continue to see strong demand. Total App purchases in Q1,
including Wix ShoutOut, were up 41% year over year. This increase
demonstrates the value the new products and services we introduced over the
past several quarters provide small businesses and highlight our ability to build
and offer businesses increasing functionality.
Our non-GAAP cost of revenue increased 42% year over year due primarily to
higher cloud hosting costs to support our rapidly scaling business and to
better meet the bandwidth needs of some of our media applications. We also
saw an increase in domain registration costs due a higher attach rate of
domain names to each new subscription. The 42% increase in our non-GAAP
cost of revenue compares to a 50% increase in revenue year over year as we
continued to scale and leverage our customer support and hosting costs.
Our non-GAAP gross margin was 85% compared to 84% of revenue last year.
Our non-GAAP gross profit (calculated as non-GAAP gross profit plus change
in deferred revenues, less deferred domain expenses) as a percentage of
collections was 87% compared to 86% in Q1 last year. We continue to
- 5-
$132
Collections per New Subscription
85%
$141
2015
$145
Q4'15 Q1'16 Q2'16 Q3'16 Q4'16 Q1'17
Source: Data based on New Annual Subscriptions; US Only
$150
Non-GAAP Gross Profit as a % Collections
87%
2016
$153
86%
$156
Q1'16
87%
Q1'17
WIX.comView entire presentation