Vroom Investor Day Presentation Deck
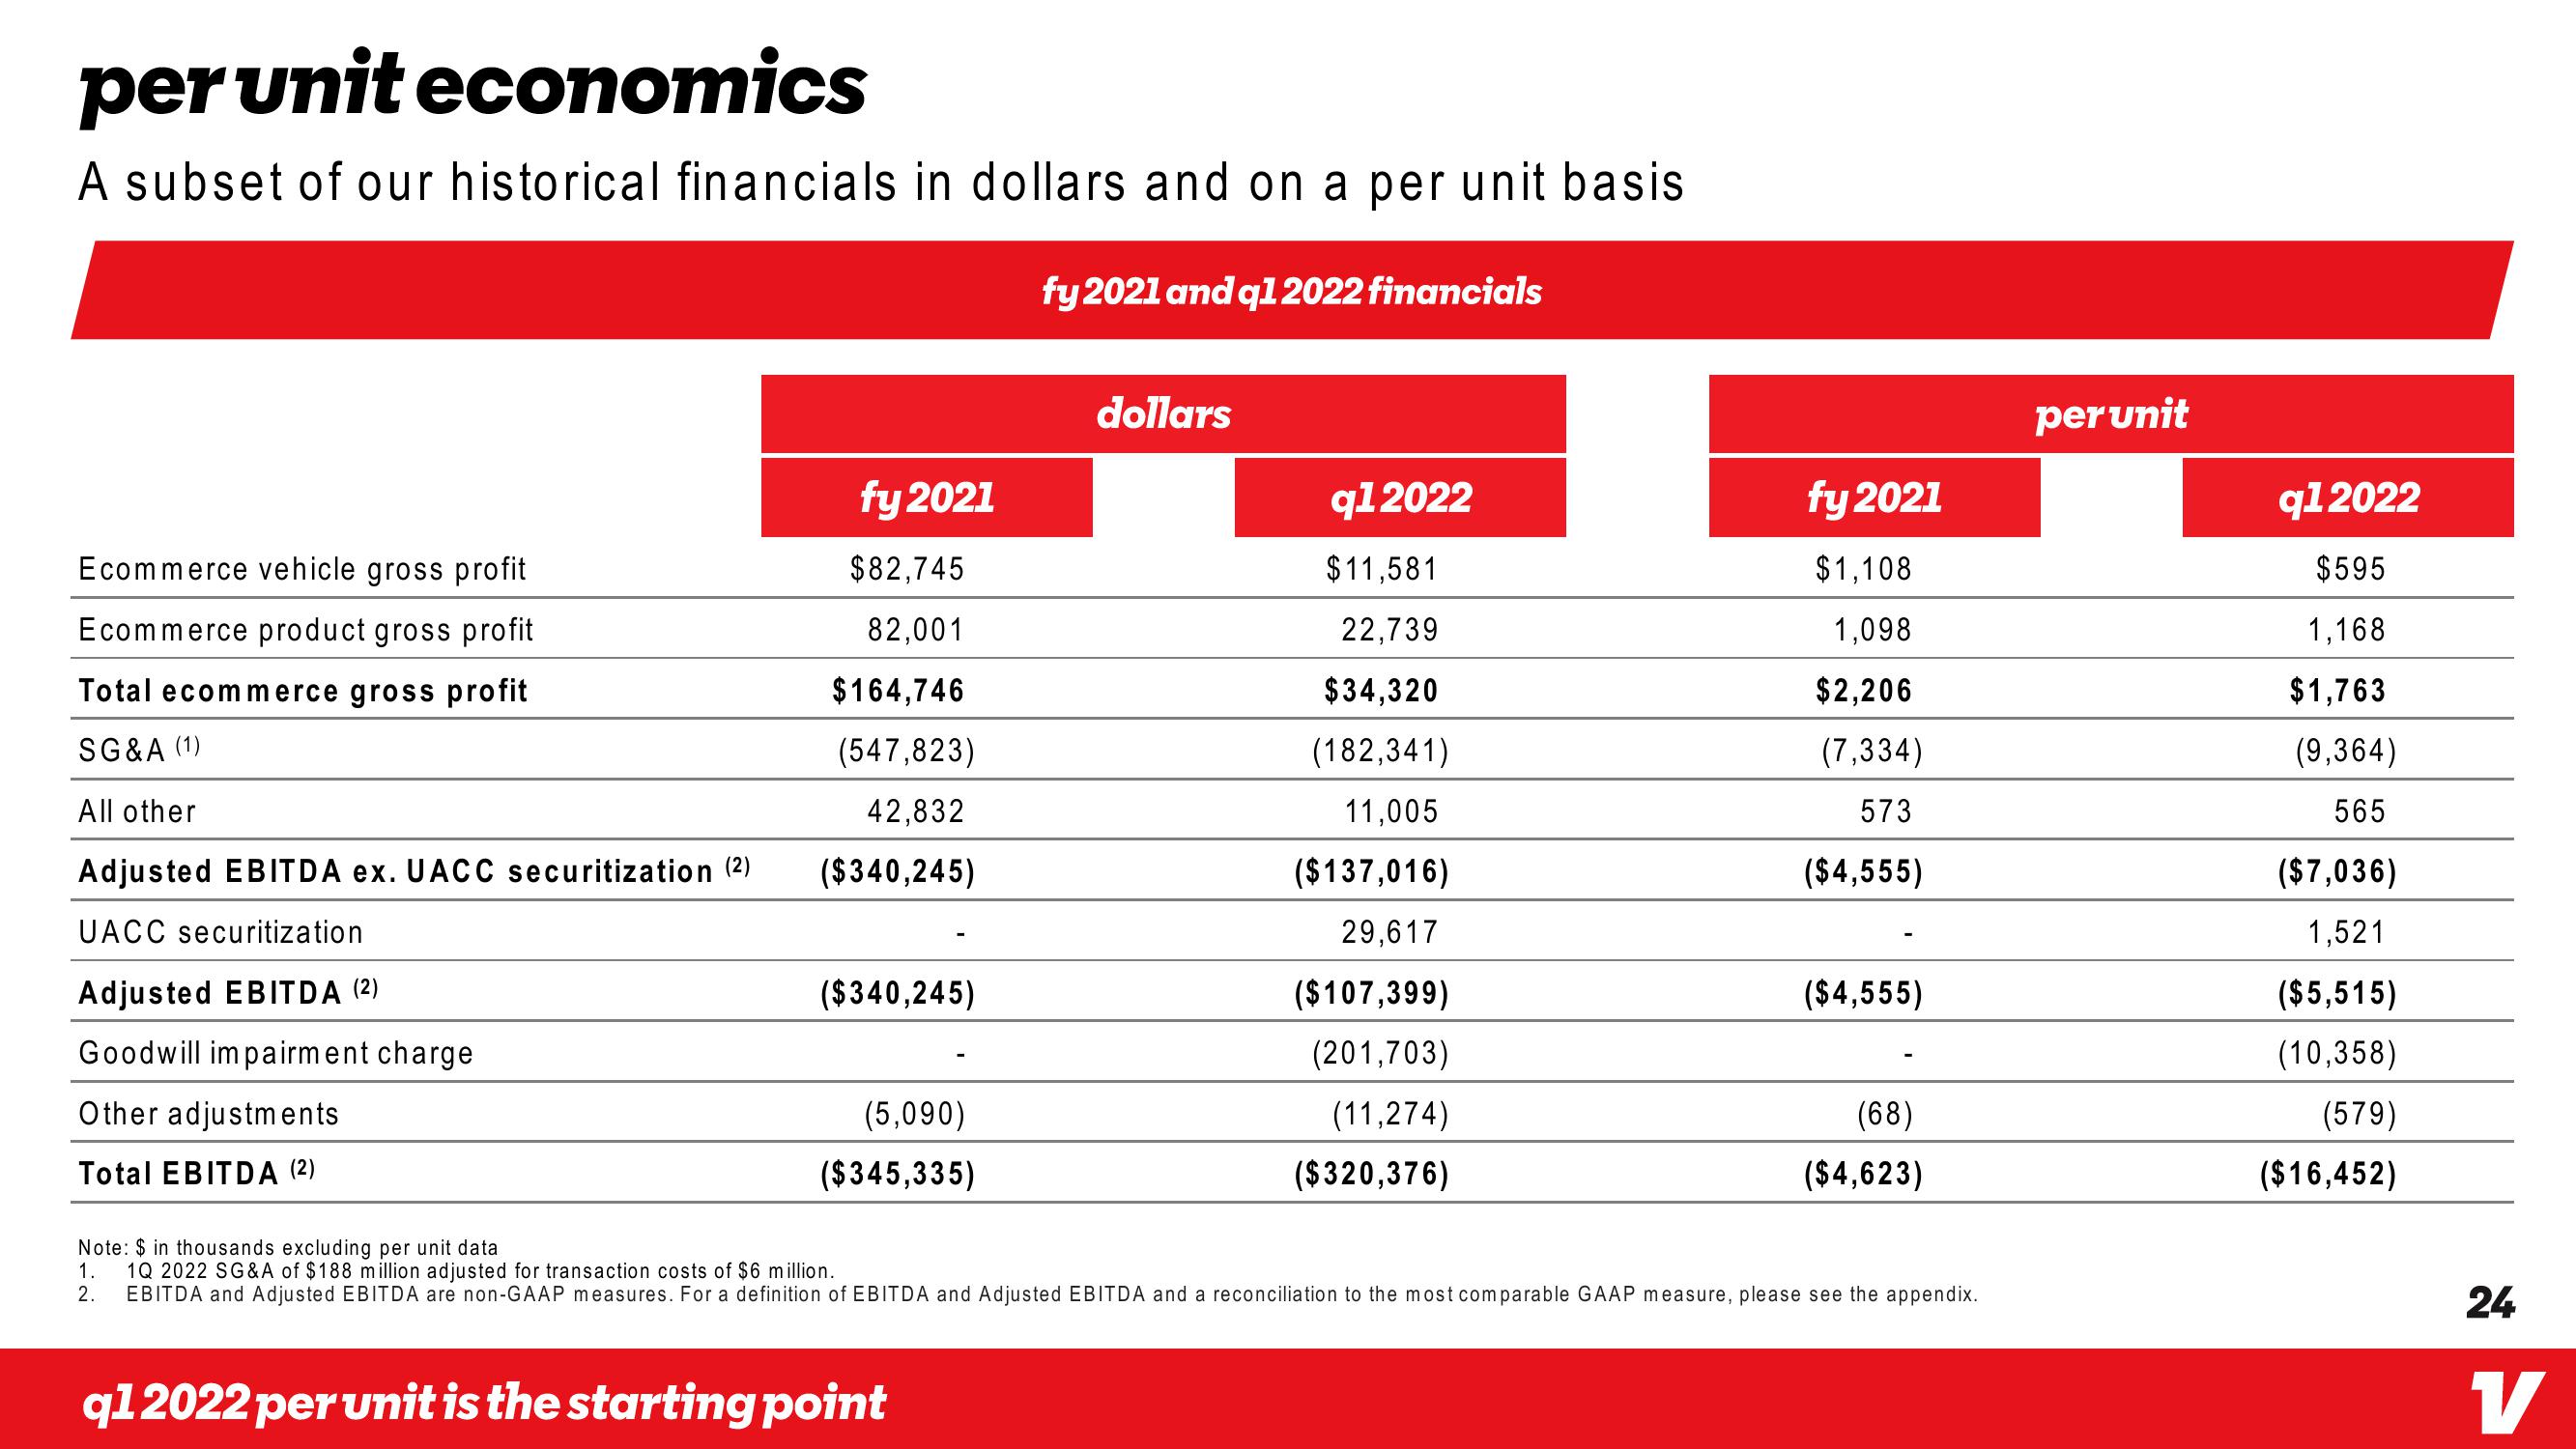
per unit economics
A subset of our historical financials in dollars and on a per unit basis.
fy 2021 and q1 2022 financials
Ecommerce vehicle gross profit
Ecommerce product gross profit
Total ecommerce gross profit
SG&A (1)
All other
Adjusted EBITDA ex. UACC securitization (2)
UACC securitization
Adjusted EBITDA (2)
Goodwill impairment charge
Other adjustments
Total EBITDA (²)
fy 2021
$82,745
82,001
$164,746
(547,823)
42,832
($340,245)
($340,245)
(5,090)
($345,335)
dollars
q1 2022 per unit is the starting point
q12022
$11,581
22,739
$34,320
(182,341)
11,005
($137,016)
29,617
($107,399)
(201,703)
(11,274)
($320,376)
fy 2021
$1,108
1,098
$2,206
(7,334)
573
($4,555)
($4,555)
(68)
($4,623)
Note: $ in thousands excluding per unit data
1. 1Q 2022 SG&A of $188 million adjusted for transaction costs of $6 million.
2. EBITDA and Adjusted EBITDA are non-GAAP measures. For a definition of EBITDA and Adjusted EBITDA and a reconciliation to the most comparable GAAP measure, please see the appendix.
per unit
q12022
$595
1,168
$1,763
(9,364)
565
($7,036)
1,521
($5,515)
(10,358)
(579)
($16,452)
24
VView entire presentation