Azerion SPAC Presentation Deck
The financial result
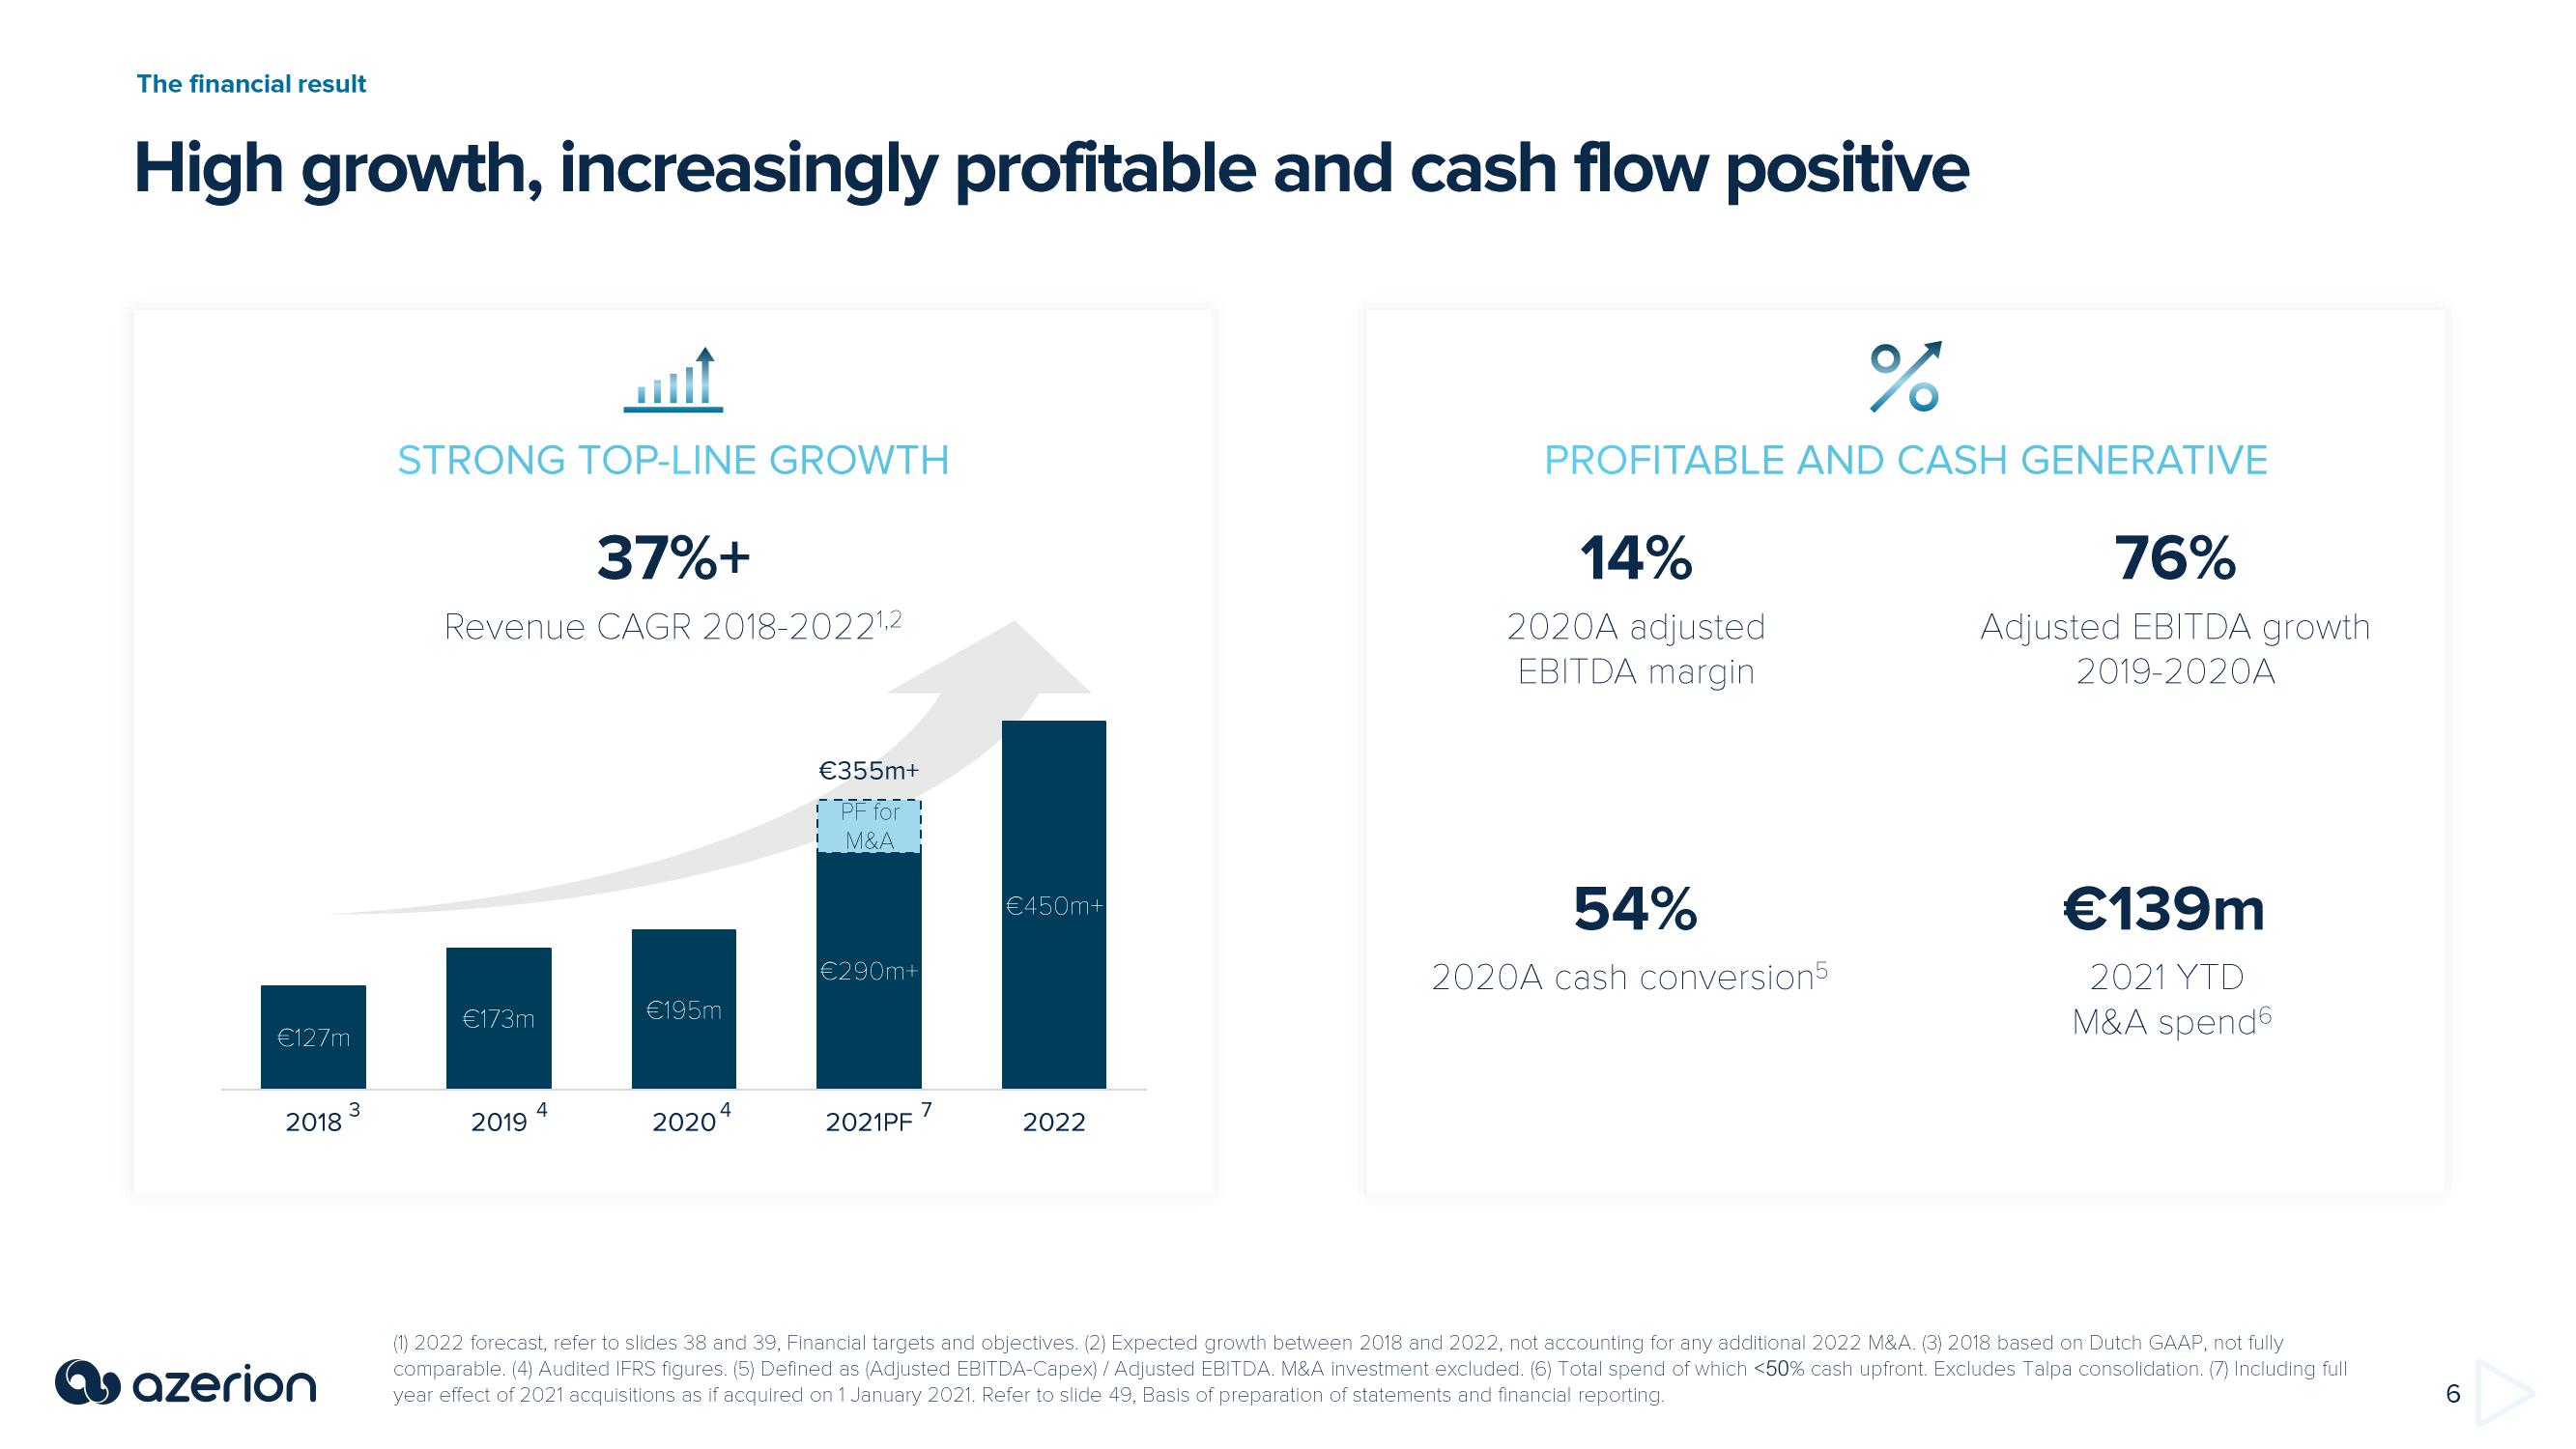
High growth, increasingly profitable and cash flow positive
€127m
2018
azerion
3
STRONG TOP-LINE GROWTH
37%+
Revenue CAGR 2018-20221,2
€173m
2019
4
€195m
20204
€355m+
PF for
M&A
€290m+
2021PF
7
€450m+
2022
%
PROFITABLE AND CASH GENERATIVE
14%
2020A adjusted
EBITDA margin
54%
2020A cash conversion5
76%
Adjusted EBITDA growth
2019-2020A
€139m
2021 YTD
M&A spend
(1) 2022 forecast, refer to slides 38 and 39, Financial targets and objectives. (2) Expected growth between 2018 and 2022, not accounting for any additional 2022 M&A. (3) 2018 based on Dutch GAAP, not fully
comparable. (4) Audited IFRS figures. (5) Defined as (Adjusted EBITDA-Capex) / Adjusted EBITDA. M&A investment excluded. (6) Total spend of which <50% cash upfront. Excludes Talpa consolidation. (7) Including full
year effect of 2021 acquisitions as if acquired on 1 January 2021. Refer to slide 49, Basis of preparation of statements and financial reporting.
6View entire presentation