TradeStation SPAC Presentation Deck
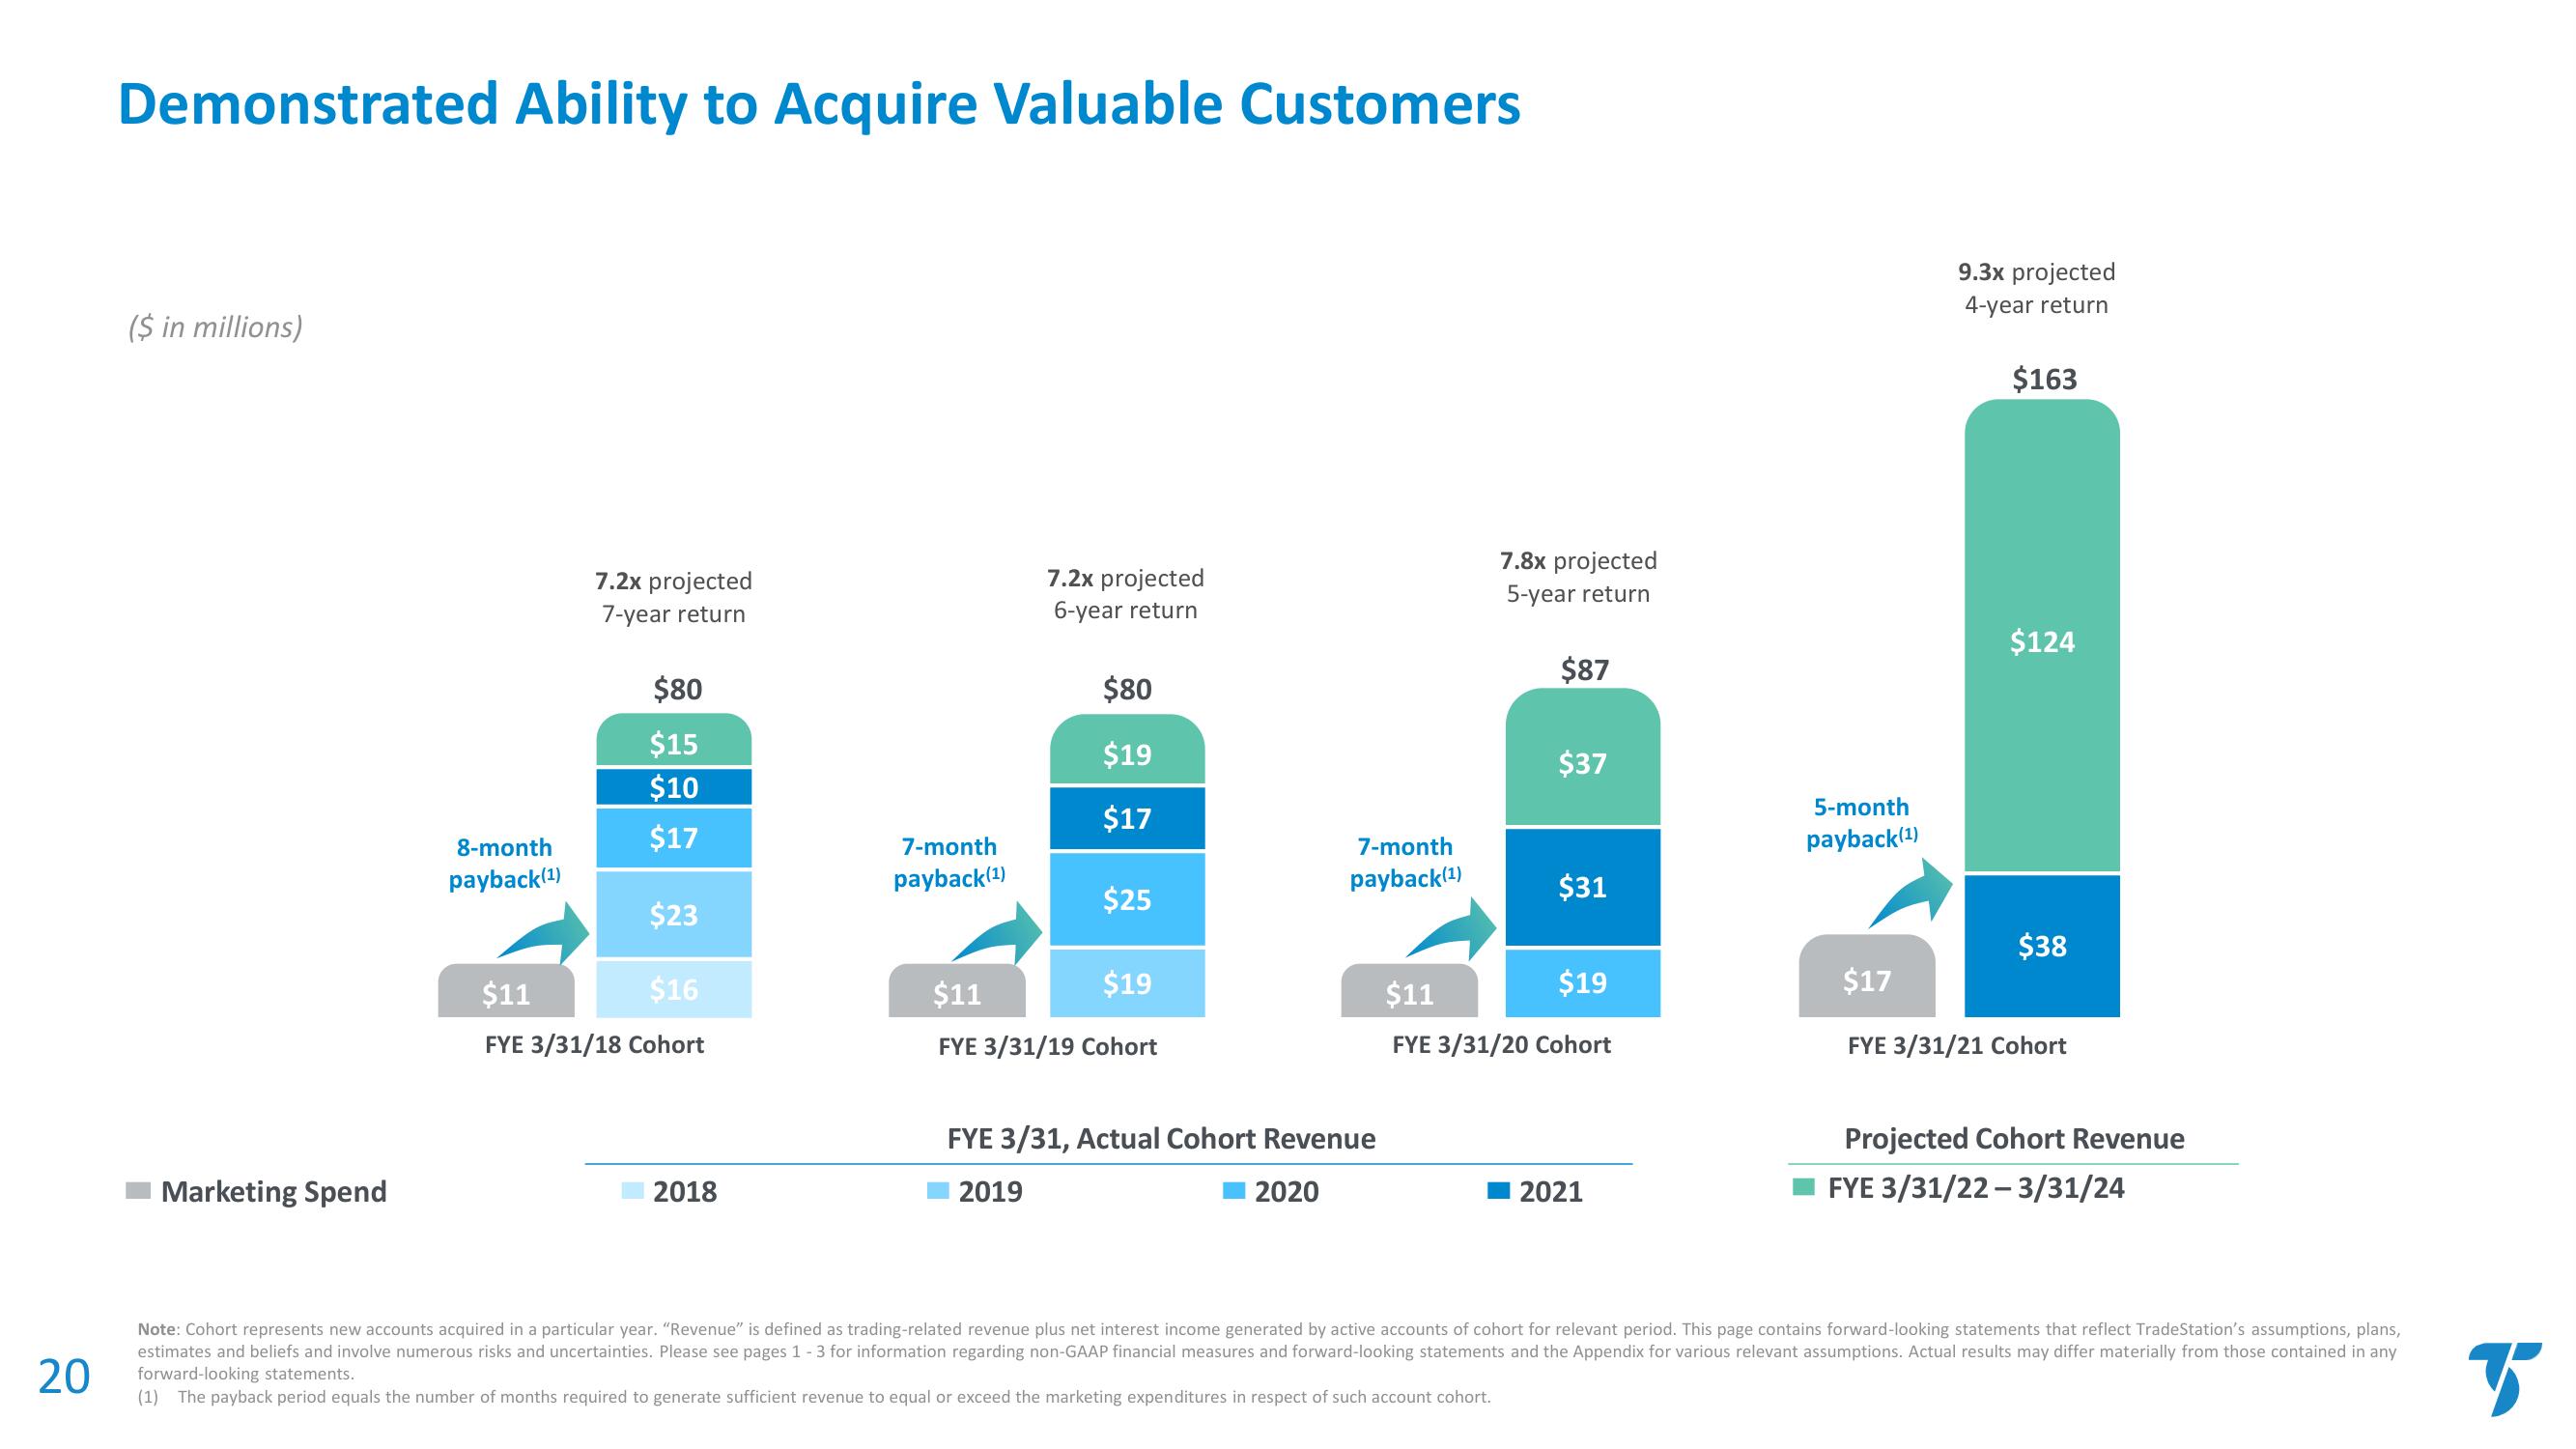
Demonstrated Ability to Acquire Valuable Customers
($ in millions)
Marketing Spend
7.2x projected
7-year return
$80
$15
$10
$17
$23
$11
$16
FYE 3/31/18 Cohort
8-month
payback(¹)
2018
7-month
payback(¹)
7.2x projected
6-year return
$80
$19
$17
$25
$11
$19
FYE 3/31/19 Cohort
7-month
payback(¹)
FYE 3/31, Actual Cohort Revenue
2019
2020
7.8x projected
5-year return
$87
$37
$31
$19
$11
FYE 3/31/20 Cohort
2021
5-month
payback(¹)
9.3x projected
4-year return
$163
$124
$38
$17
FYE 3/31/21 Cohort
Projected Cohort Revenue
FYE 3/31/22-3/31/24
20
Note: Cohort represents new accounts acquired in a particular year. "Revenue" is defined as trading-related revenue plus net interest income generated by active accounts of cohort for relevant period. This page contains forward-looking statements that reflect TradeStation's assumptions, plans,
estimates and beliefs and involve numerous risks and uncertainties. Please see pages 1 - 3 for information regarding non-GAAP financial measures and forward-looking statements and the Appendix for various relevant assumptions. Actual results may differ materially from those contained in any
forward-looking statements.
(1) The payback period equals the number of months required to generate sufficient revenue to equal or exceed the marketing expenditures in respect of such account cohort.
BView entire presentation