Bed Bath & Beyond Results Presentation Deck
■
Second Quarter Highlights
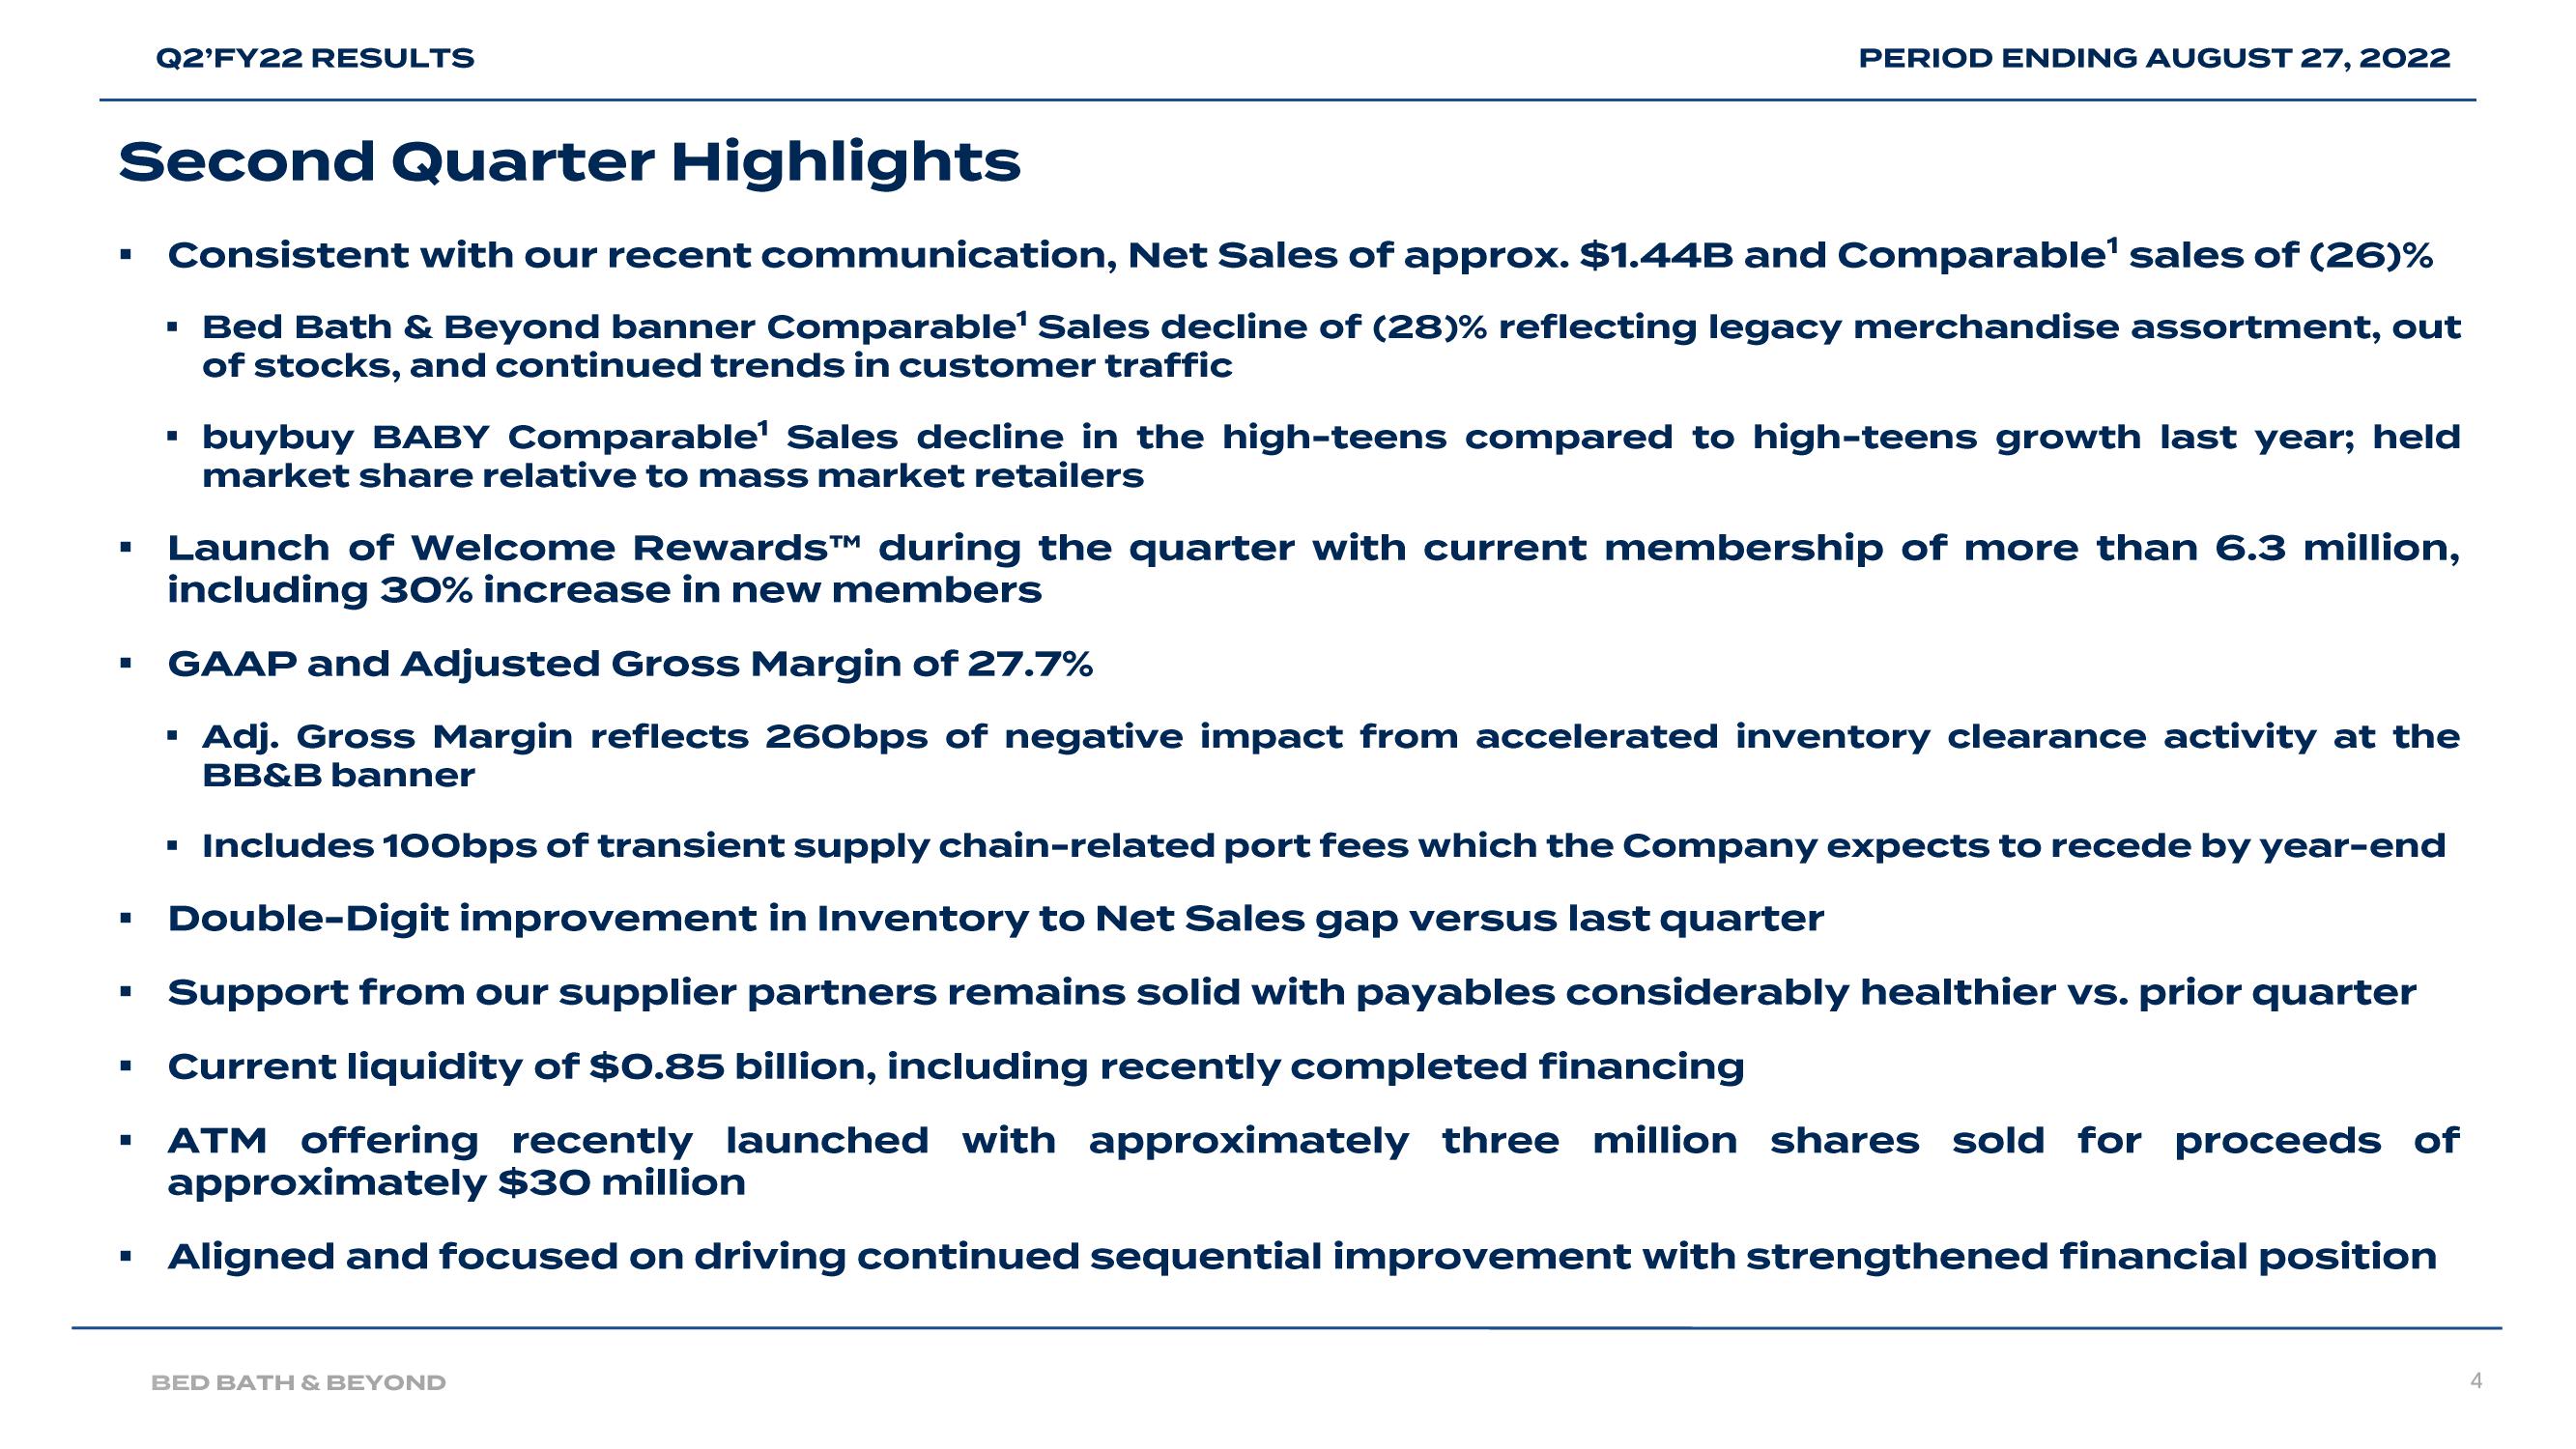
Consistent with our recent communication, Net Sales of approx. $1.44B and Comparable¹ sales of (26)%
▪ Bed Bath & Beyond banner Comparable¹ Sales decline of (28) % reflecting legacy merchandise assortment, out
of stocks, and continued trends in customer traffic
■
■
■
Q2'FY22 RESULTS
■
■
PERIOD ENDING AUGUST 27, 2022
-
buybuy BABY Comparable¹ Sales decline in the high-teens compared to high-teens growth last year; held
market share relative to mass market retailers
Launch of Welcome RewardsTM during the quarter with current membership of more than 6.3 million,
including 30% increase in new members
GAAP and Adjusted Gross Margin of 27.7%
Adj. Gross Margin reflects 260bps of negative impact from accelerated inventory clearance activity at the
BB&B banner
▪ Includes 100bps of transient supply chain-related port fees which the Company expects to recede by year-end
Double-Digit improvement in Inventory to Net Sales gap versus last quarter
Support from our supplier partners remains solid with payables considerably healthier vs. prior quarter
Current liquidity of $0.85 billion, including recently completed financing
ATM offering recently launched with approximately three million shares sold for proceeds of
approximately $30 million
Aligned and focused on driving continued sequential improvement with strengthened financial position
BED BATH & BEYOND
4View entire presentation