Inovalon Results Presentation Deck
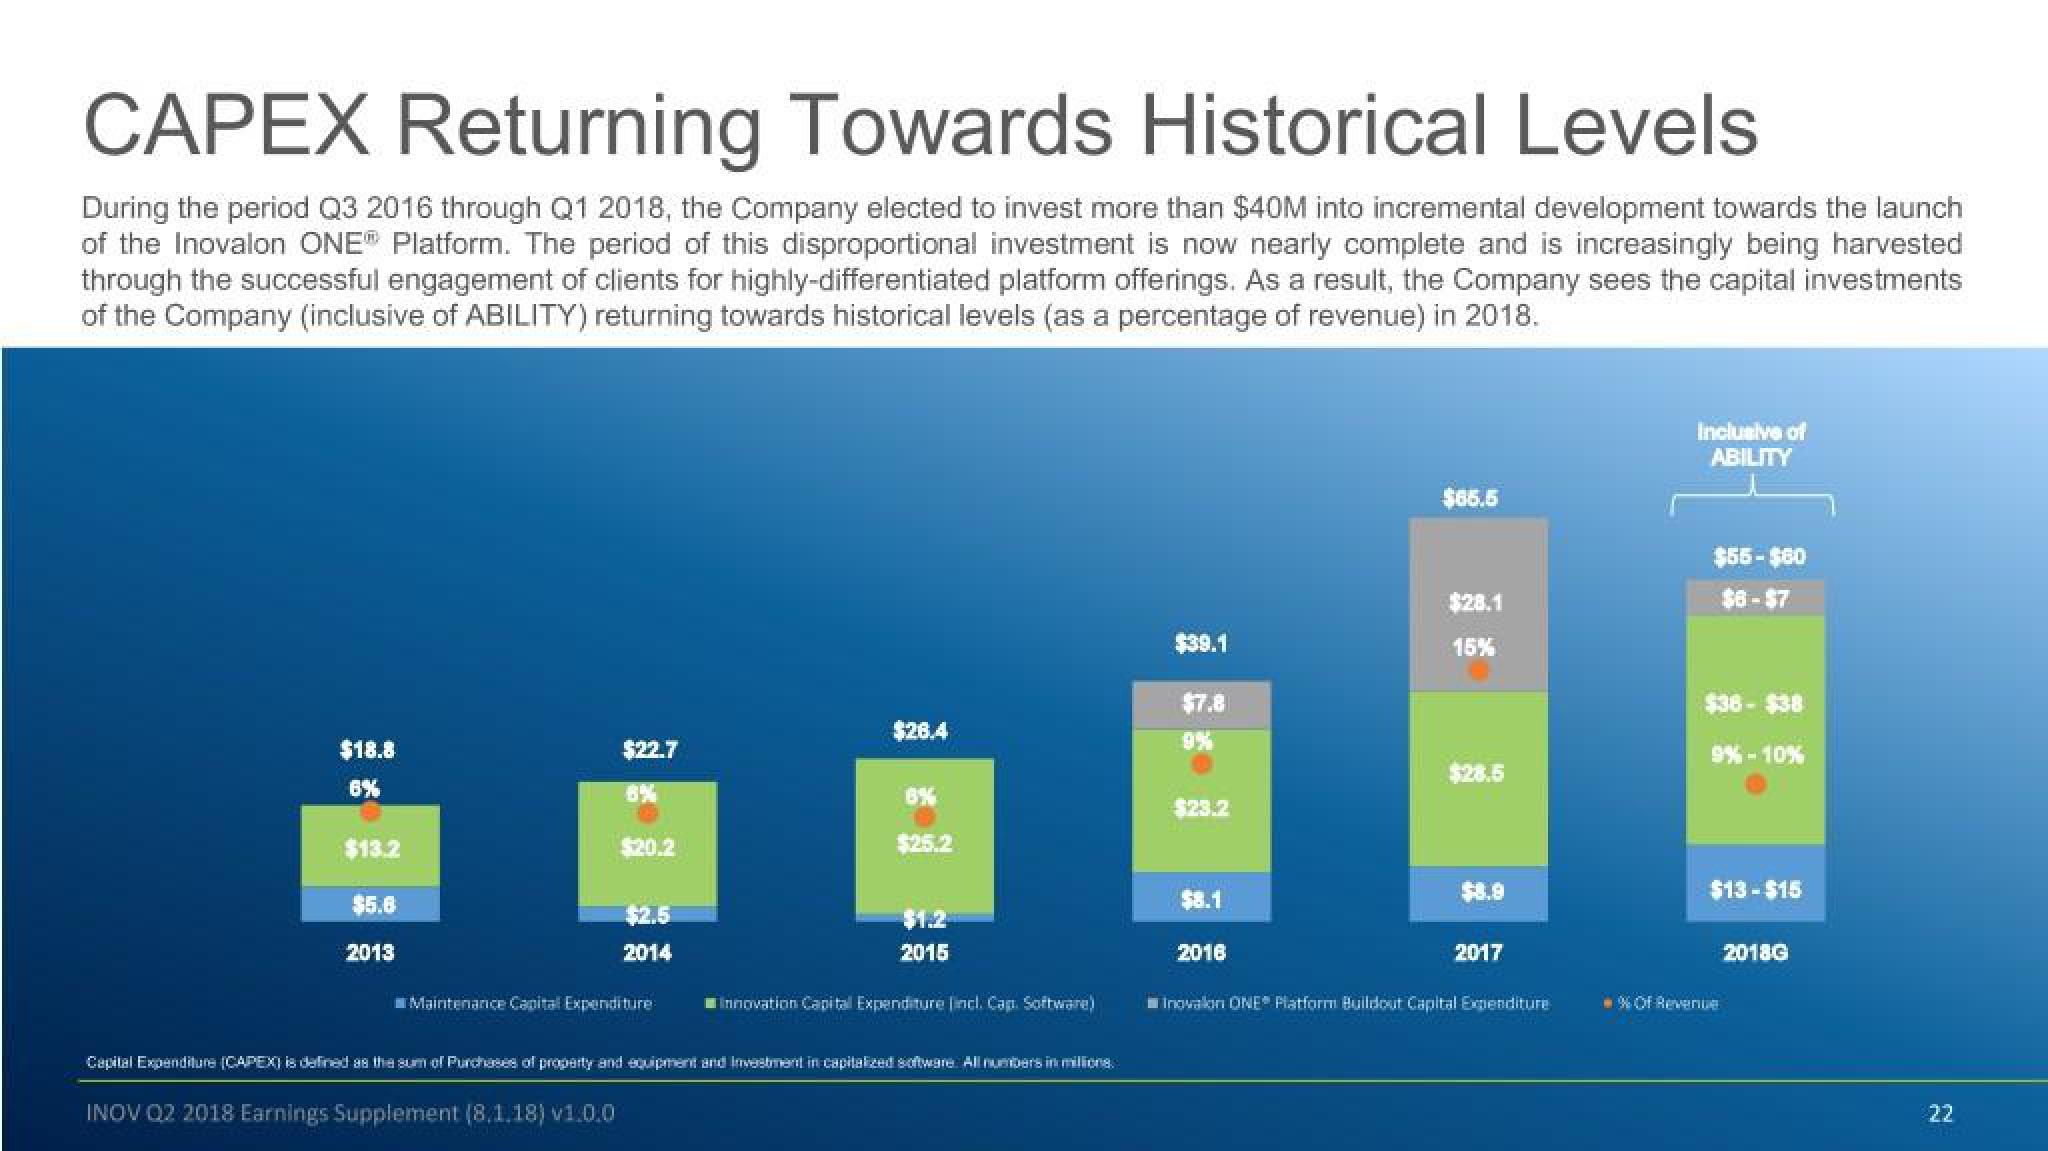
CAPEX Returning Towards Historical Levels
During the period Q3 2016 through Q1 2018, the Company elected to invest more than $40M into incremental development towards the launch
of the Inovalon ONE® Platform. The period of this disproportional investment is now nearly complete and is increasingly being harvested
through the successful engagement of clients for highly-differentiated platform offerings. As a result, the Company sees the capital investments
of the Company (inclusive of ABILITY) returning towards historical levels (as a percentage of revenue) in 2018.
$18.8
6%
$13.2
$5.6
2013
$22.7
B%
$20.2
INOV Q2 2018 Earnings Supplement (8.1.18) v1.0.0
$2.5
2014
Maintenance Capital Expenditure
$26.4
6%
$25.2
$1.2
2015
Innovation Capital Expenditure [incl. Cap. Software)
Capital Expenditure (CAPEX) is defined as the sum of Purchases of property and equipment and Investment in capitalized software. All numbers in millions.
$39.1
$7.8
$23.2
2016
$65.5
$28.1
15%
$28.5
$8.9
2017
Inovalon ONE Platform Buildout Capital Expenditure
Inclusive of
ABILITY
$55 - $60
$6-$7
$38-$38
9%-10%
$13-$15
% Of Revenue
2018G
22View entire presentation