Zegna Results Presentation Deck
GROUP REVENUES BY SALES CHANNEL
(UNAUDITED)
(€ thousands,
except
percentages)
Direct to
Consumer
(DTC)
Zegna branded
products
Thom Browne
Tom Ford
Fashion
Total Direct to
Consumer
(DTC)
Wholesale
Zegna branded
products
Thom Browne
Tom Ford
Fashion
Third Party
Brands and
Textile
Total
Wholesale
Other
9M 2023
661,143
126,272
77,792
865,207
122,505
153,855
60,775
128,553
465,688
3,294
Total revenues 1,334,189
% of
Revenues
64.8%
34.9%
0.3%
9M 2022
542.228
102,719
644,947
107,340
151,627
178,860
437,827
3,093
% of
Revenues
59.4%
40.3%
0.3%
100.0% 1,085,867 100.0%
9M 2023 vs 9M 2022
Reported
Revenues
21.9%
22.9%
n.m.
34.2%
14.1%
1.5%
n.m.
(28.1%)
6.4%
n.m.
22.9%
Constant
Currency
25.0%
31.1%
n.m.
38.4%
12.7%
1.6%
n.m.
(28.9%)
5.7%
n.m.
24.8%
Organic
Growth
25.0%
22.5%
n.m.
24.6%
12.7%
10.5%
n.m.
6.5%
9.9%
n.m.
19.2%
Q3 2023
195,433
43,348
43,041
281,822
46,896
29,828
31,511
40,004
148,239
1,069
431,130
% of
Revenues
65.4%
34.4%
0.2%
100.0%
Q3 2022
180,378
36,545
216,923
43,938
32,635
62,551
139,124
827
% of
Revenues
60.8%
39.0%
0.2%
356,874 100.0%
8.3%
Reported Constant
Revenues
Currency
18.6%
Q3 2023 vs Q3 2022
n.m.
29.9%
6.7%
(8.6%)
n.m.
(36.0%)
6.6%
Ermenegildo Zegna Group
n.m.
20.8%
14.0%
32.1%
n.m.
37.7%
5.0%
(7.8%)
n.m.
(36.3%)
6.1%
n.m.
25.0%
Organic
Growth
14.0%
7.7%
nm.
12.9%
5.0%
8.3%
n.m.
11.5%
8.1%
|¹|4|
n.m.
11.3%
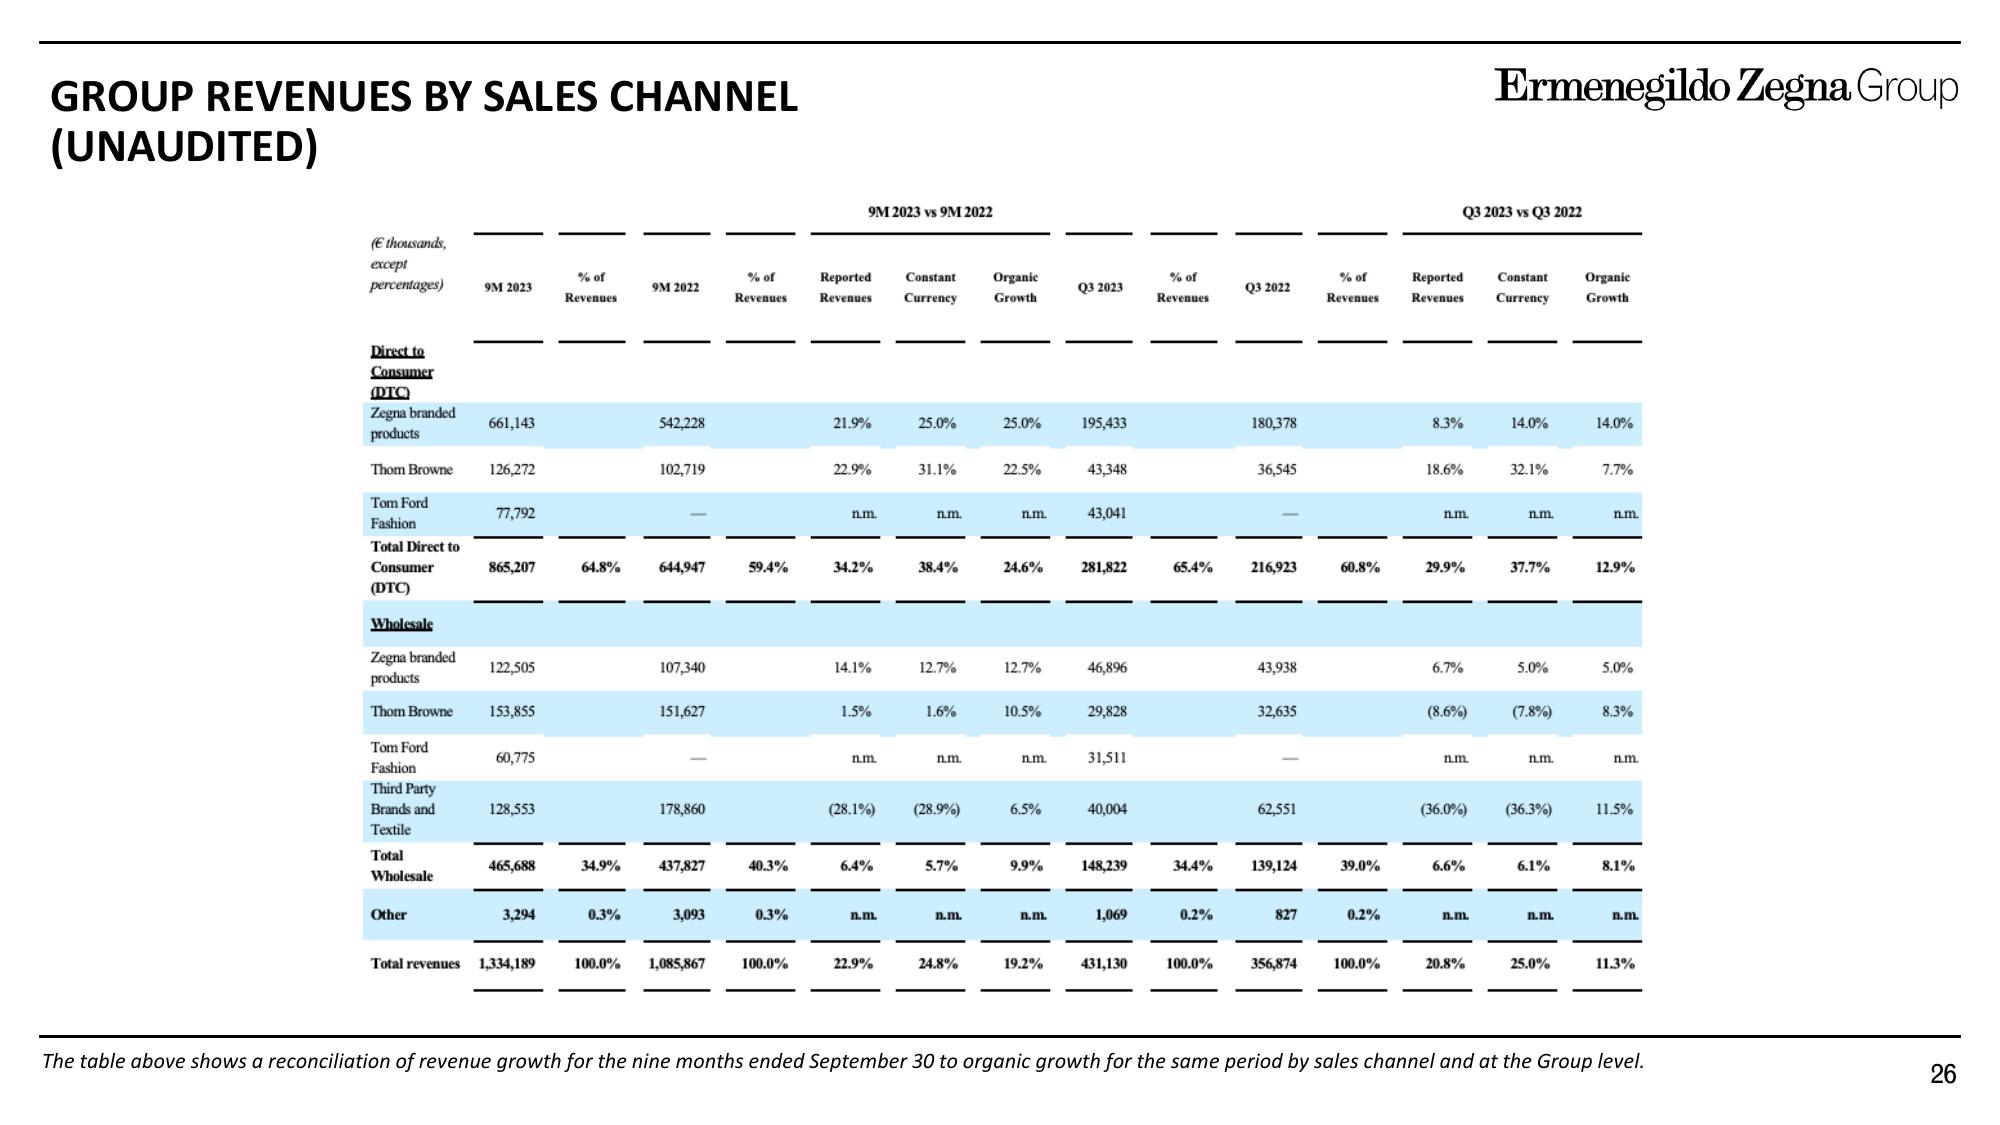
The table above shows a reconciliation of revenue growth for the nine months ended September 30 to organic growth for the same period by sales channel and at the Group level.
26View entire presentation