Pershing Square Activist Presentation Deck
B. PF McDonald's Financial Analysis
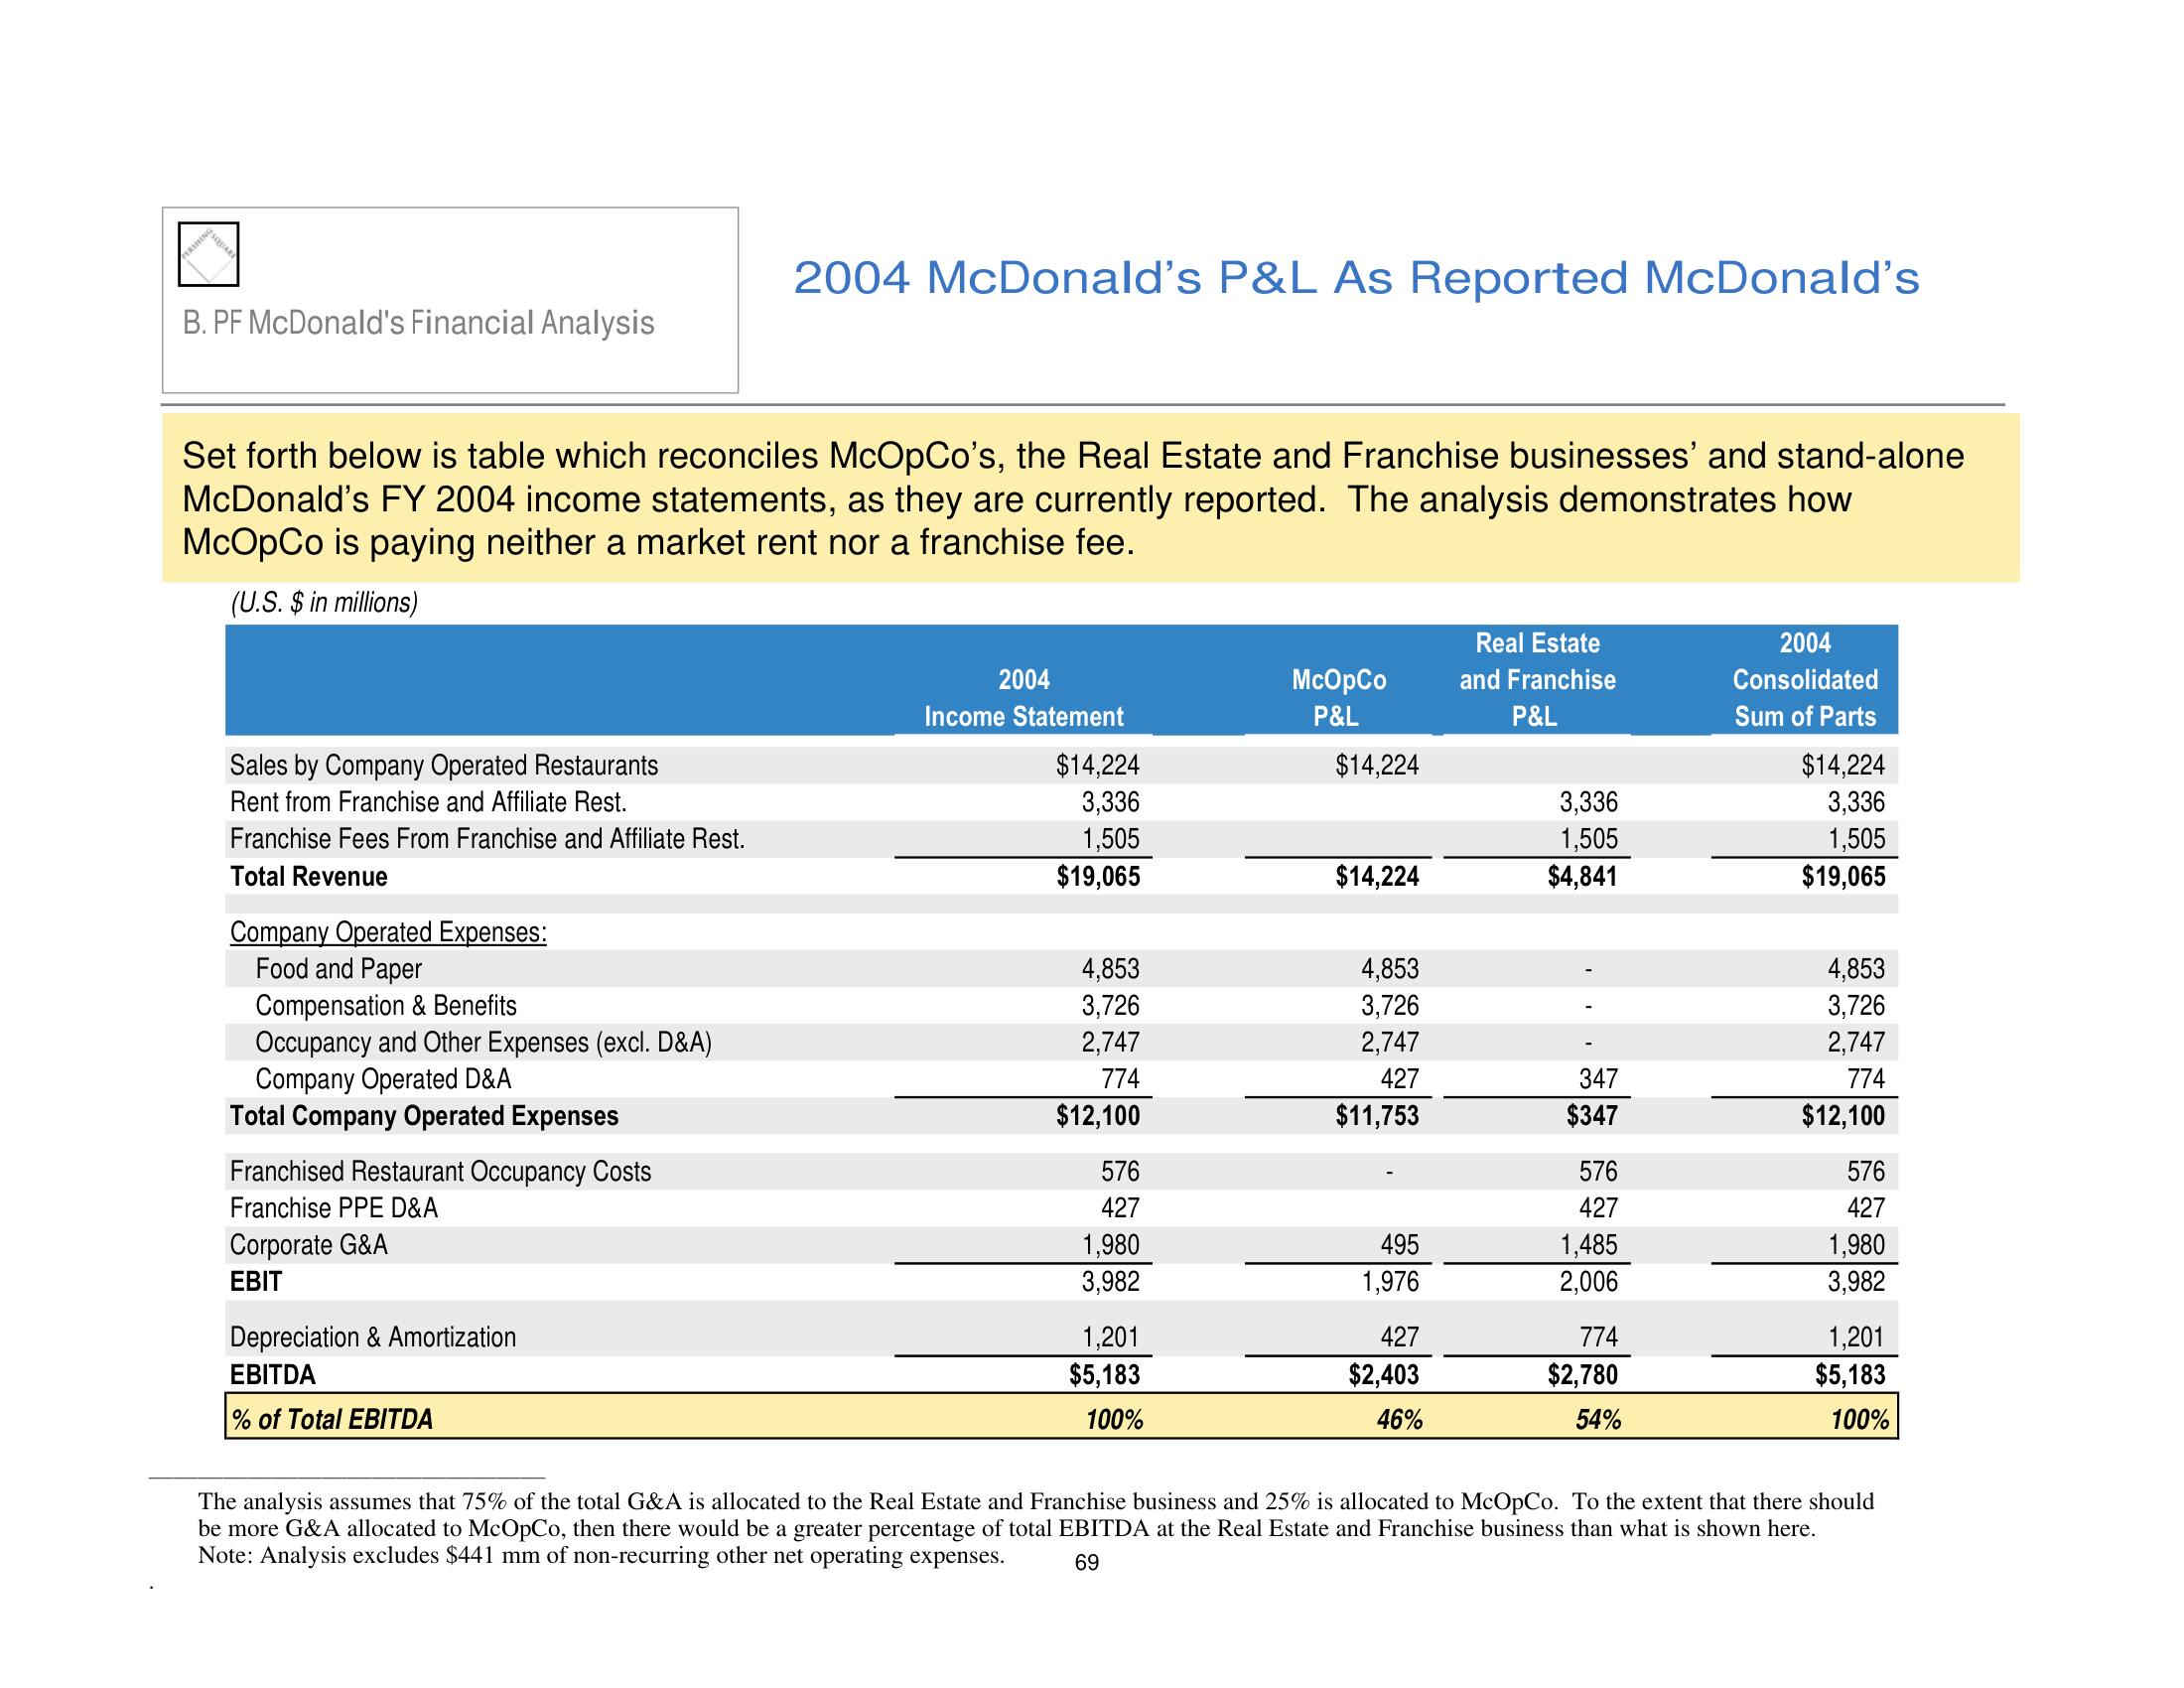
Set forth below is table which reconciles McOpCo's, the Real Estate and Franchise businesses' and stand-alone
McDonald's FY 2004 income statements, as they are currently reported. The analysis demonstrates how
McOpCo is paying neither a market rent nor a franchise fee.
(U.S. $ in millions)
Sales by Company Operated Restaurants
Rent from Franchise and Affiliate Rest.
Franchise Fees From Franchise and Affiliate Rest.
Total Revenue
Company Operated Expenses:
Food and Paper
Compensation & Benefits
Occupancy and Other Expenses (excl. D&A)
Company Operated D&A
Total Company Operated Expenses
Franchised Restaurant Occupancy Costs
Franchise PPE D&A
Corporate G&A
EBIT
2004 McDonald's P&L As Reported McDonald's
Depreciation & Amortization
EBITDA
% of Total EBITDA
2004
Income Statement
$14,224
3,336
1,505
$19,065
4,853
3,726
2,747
774
$12,100
576
427
1,980
3,982
1,201
$5,183
100%
McOpCo
P&L
$14,224
$14,224
4,853
3,726
2,747
427
$11,753
495
1,976
427
$2,403
46%
Real Estate
and Franchise
P&L
3,336
1,505
$4,841
347
$347
576
427
1,485
2,006
774
$2,780
54%
2004
Consolidated
Sum of Parts
$14,224
3,336
1,505
$19,065
4,853
3,726
2,747
774
$12,100
576
427
1,980
3,982
1,201
$5,183
100%
The analysis assumes that 75% of the total G&A is allocated to the Real Estate and Franchise business and 25% is allocated to McOpCo. To the extent that there should
be more G&A allocated to McOpCo, then there would be a greater percentage of total EBITDA at the Real Estate and Franchise business than what is shown here.
Note: Analysis excludes $441 mm of non-recurring other net operating expenses. 69View entire presentation