Evotec Investor Day Presentation Deck
Normalized database growth
evotec
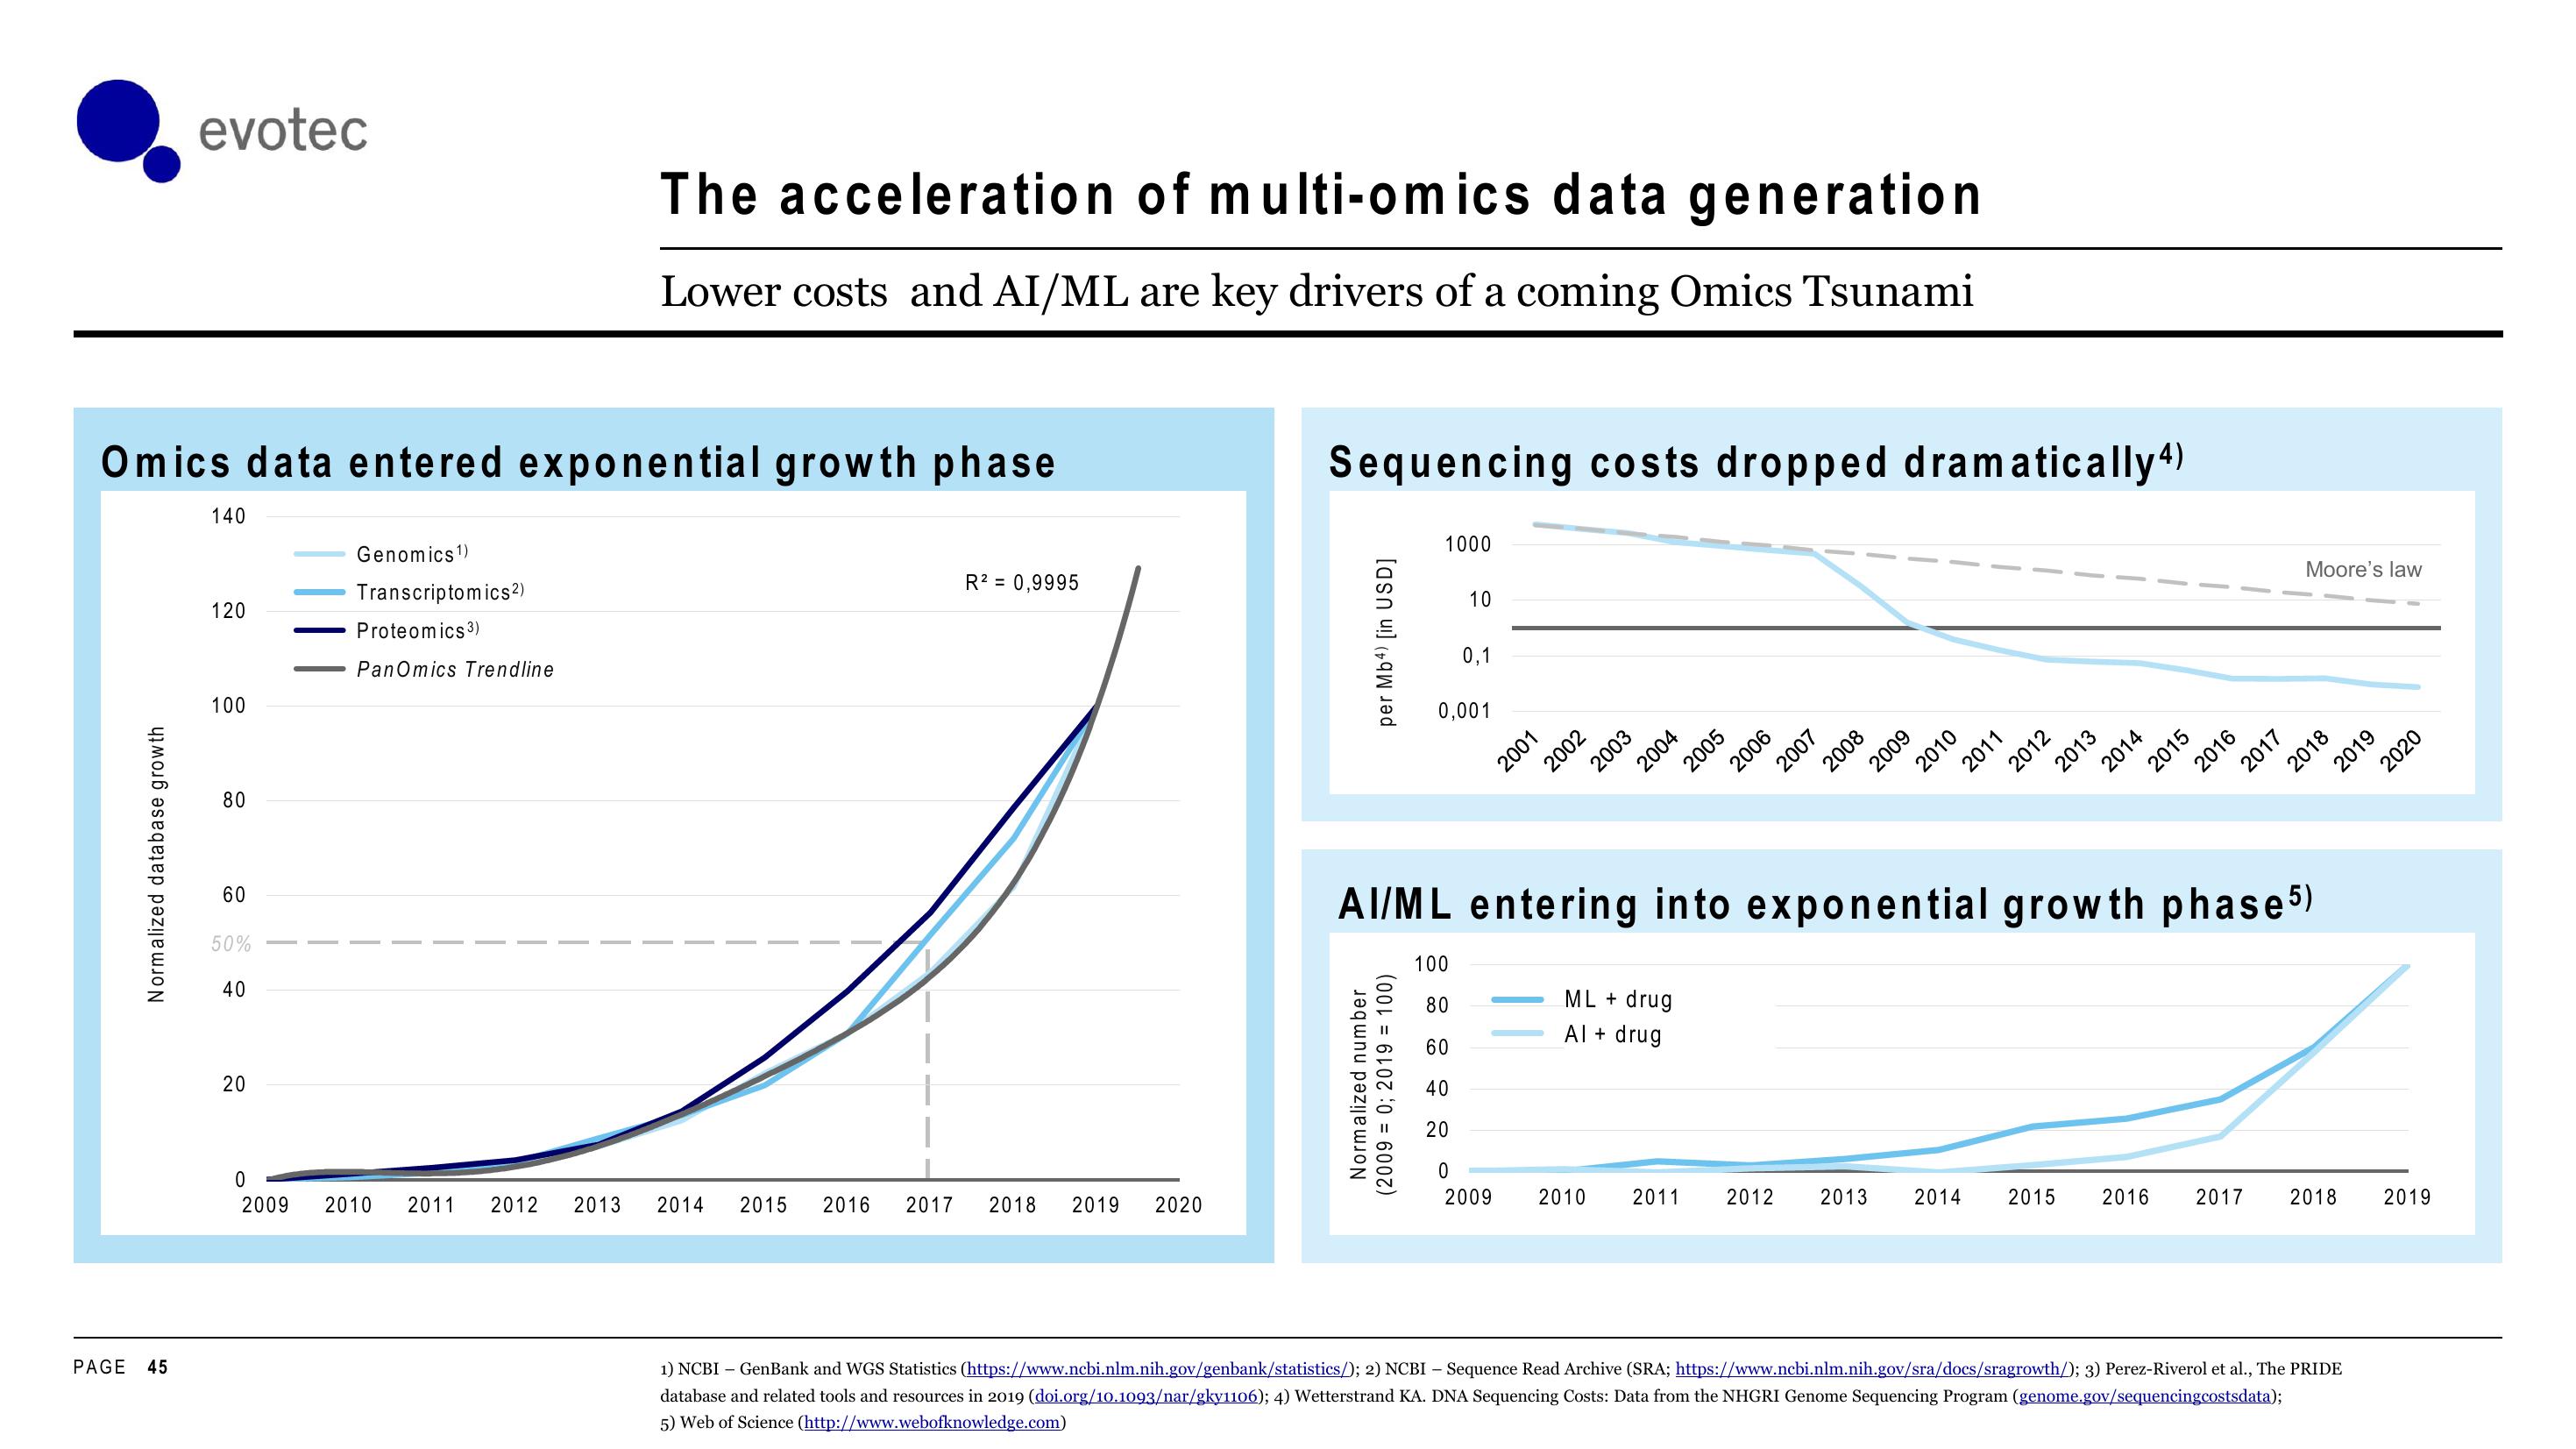
Omics data entered exponential growth phase
PAGE 45
140
120
100
80
60
50%
40
20
Genomics ¹)
Transcriptomics ²)
Proteomics 3)
Pan Omics Trendline
The acceleration of multi-omics data generation
Lower costs and AI/ML are key drivers of a coming Omics Tsunami
0
2009 2010 2011 2012
2013 2014
2015 2016 2017
R² = 0,9995
2018 2019
2020
Sequencing costs dropped dramatically4)
per Mb4) [in USD]
1000
Normalized number
(2009= 0; 2019 = 100)
10
0,1
0,001
2001
2002
2003
2004
2005
ML + drug
Al + drug
2006
2007
2012
2008
2009
2010
2011
2012
2013
2014
2013 2014 2015
2015
AI/ML entering into exponential growth phase 5)
100
80
60
40
20
0
2009 2010 2011
2016
2017
Moore's law
2018
2016 2017 2018
1) NCBI GenBank and WGS Statistics (https://www.ncbi.nlm.nih.gov/genbank/statistics/); 2) NCBI - Sequence Read Archive (SRA; https://www.ncbi.nlm.nih.gov/sra/docs/sragrowth/); 3) Perez-Riverol et al., The PRIDE
database and related tools and resources in 2019 (doi.org/10.1093/nar/gky1106); 4) Wetterstrand KA. DNA Sequencing Costs: Data from the NHGRI Genome Sequencing Program (genome.gov/sequencingcostsdata);
5) Web of Science (http://www.webofknowledge.com)
2019
2020
2019View entire presentation