REE SPAC Presentation Deck
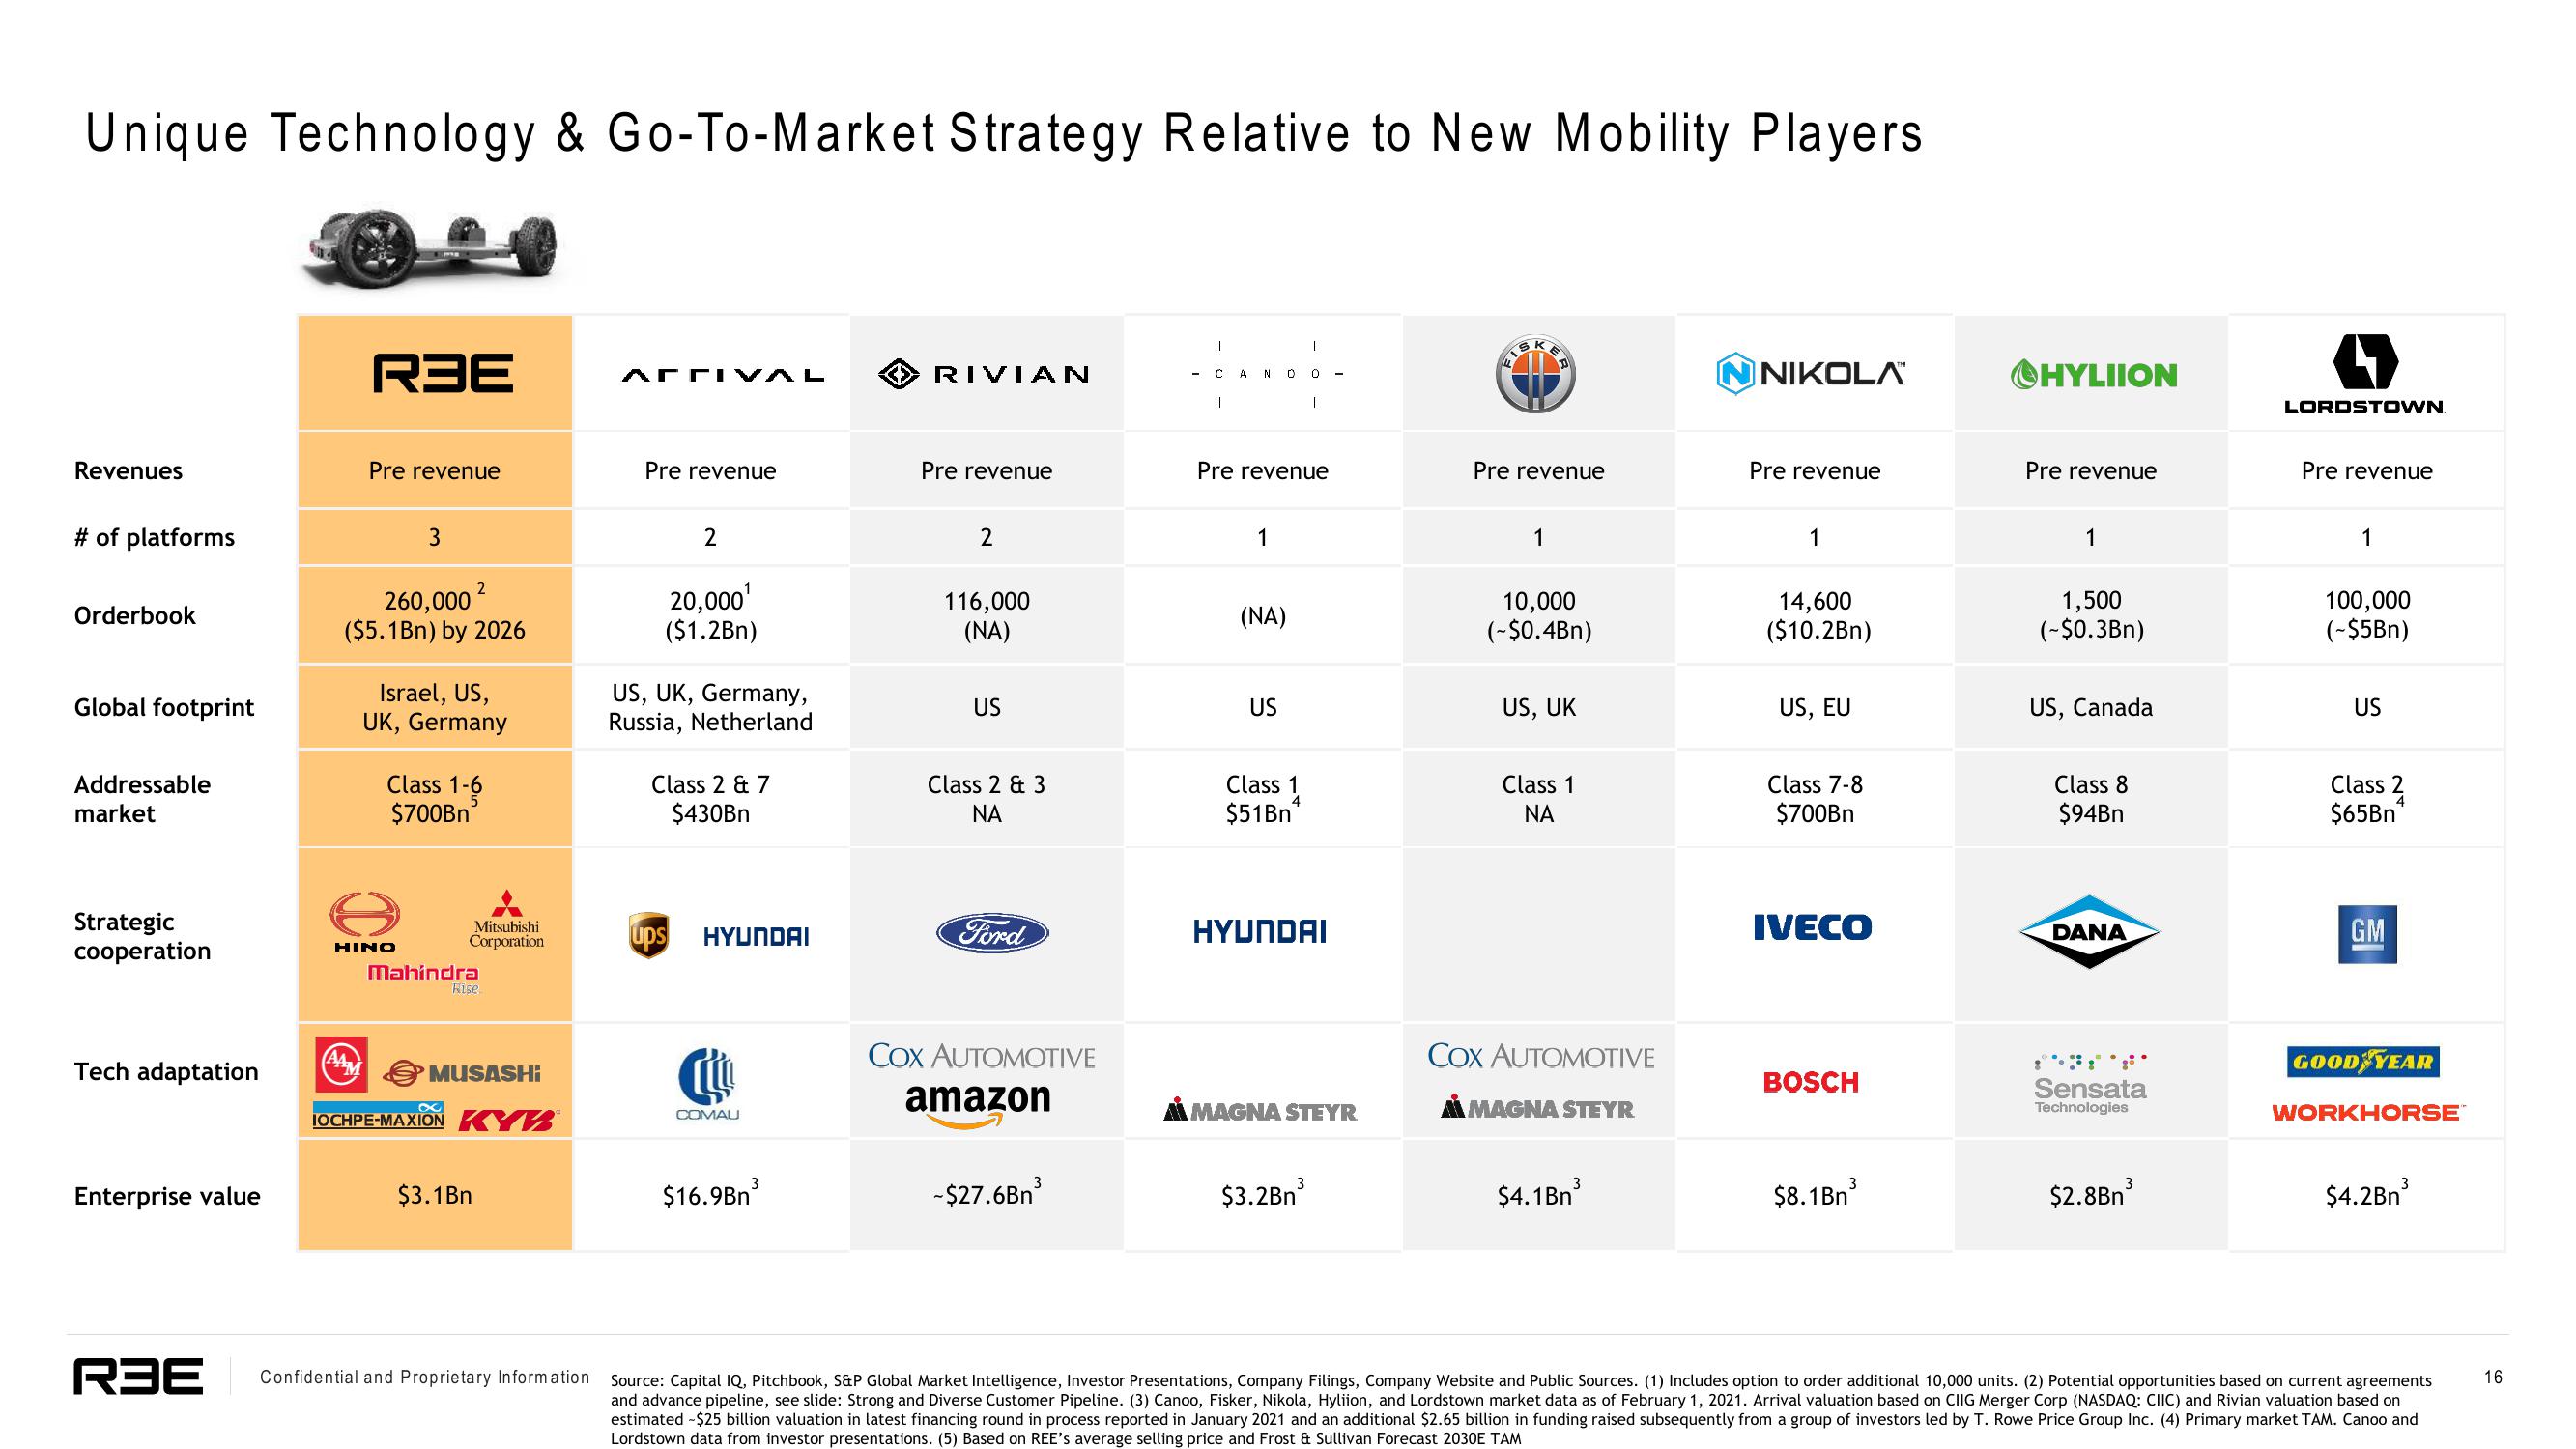
Unique Technology & Go-To-Market Strategy Relative to New Mobility Players
Revenues
# of platforms
Orderbook
Global footprint
Addressable
market
Strategic
cooperation
Tech adaptation
Enterprise value
RBE
Pre revenue
260,000 ²
($5.1Bn) by 2026
AAM
3
Israel, US,
UK, Germany
HINO
Class 1-6
$700Bn
5
Mitsubishi
Corporation
Mahindra
Rise
MUSASHI
IOCHPE-MAXION KYB
$3.1Bn
RBE Confidential and Proprietary Information
ACTIVAL
Pre revenue
2
20,000¹
($1.2Bn)
US, UK, Germany,
Russia, Netherland
Class 2 & 7
$430Bn
ups
HYUNDAI
COMAU
$16.9Bn³
RIVIAN
Pre revenue
2
116,000
(NA)
US
Class 2 & 3
ΝΑ
Ford
COX AUTOMOTIVE
amazon
-$27.6Bn
1
CAN 0
1
Pre revenue
(NA)
US
Class 1
$51Bn
1
0
HYUNDAI
$3.2Bn³
MAGNA STEYR
L
Pre revenue
1
10,000
(-$0.4Bn)
US, UK
Class 1
ΝΑ
COX AUTOMOTIVE
MAGNA STEYR
$4.1Bn³
NIKOLA
Pre revenue
1
14,600
($10.2Bn)
US, EU
Class 7-8
$700Bn
IVECO
BOSCH
$8.1Bn³
ⒸHYLIION
Pre revenue
1
1,500
(-$0.3Bn)
US, Canada
Class 8
$94Bn
DANA
Sensata
Technologies
3
$2.8Bn³
LORDSTOWN.
Pre revenue
1
100,000
(-$5Bn)
US
Class 2
$65Bn
GM
GOOD YEAR
WORKHORSE
$4.2Bn³
Source: Capital IQ, Pitchbook, S&P Global Market Intelligence, Investor Presentations, Company Filings, Company Website and Public Sources. (1) Includes option to order additional 10,000 units. (2) Potential opportunities based on current agreements
and advance pipeline, see slide: Strong and Diverse Customer Pipeline. (3) Canoo, Fisker, Nikola, Hyliion, and Lordstown market data as of February 1, 2021. Arrival valuation based on CIIG Merger Corp (NASDAQ: CIIC) and Rivian valuation based on
estimated -$25 billion valuation in latest financing round in process reported in January 2021 and an additional $2.65 billion in funding raised subsequently from a group of investors led by T. Rowe Price Group Inc. (4) Primary market TAM. Canoo and
Lordstown data from investor presentations. (5) Based on REE's average selling price and Frost & Sullivan Forecast 2030E TAM
16View entire presentation