J.P.Morgan Results Presentation Deck
Corporate & Investment Bank1
SELECTED INCOME STATEMENT DATA ($MM)
Revenue
Investment Banking revenue
Payments²
Lending
Total Banking
Fixed Income Markets
Equity Markets
Securities Services.
Credit Adjustments & Other
Total Markets & Securities Services
Expense²
Credit costs
Net income
KEY DRIVERS / STATISTICS ($B)³
Equity
ROE
Overhead ratio
Comp/revenue
IB fees ($mm)
Average loans
4
Average client deposits
Merchant processing volume
Assets under custody ($T)
6
Net charge-off/(recovery) rate
Average VaR ($mm)
1 See note 1 on slide 13
2 See note 3 on slide 14
For additional footnotes see slide 15
JPMORGAN CHASE & CO.
4Q23
$10,958
1,576
2,332
150
4,058
4,033
1,778
1,191
(102)
6,900
6,774
210
$2,524
4Q23
$108.0
9%
62
31
$1,654
233.3
660.8
639
32.4
0.25%
$32
$ 0/(U)
3Q23
($772)
(37)
238
(141)
60
(481)
(289)
(21)
(41)
212
(173)
226
294
(153)
32
(39)
(832)
134
(669)
279
395
69
($568) ($790)
3Q23
$108.0
11%
63
29
4Q22
$360
$1,717
232.9
638.1
610
29.7
0.09%
$38
4Q22
$103.0
12%
61
29
$1,467
225.8
649.7
583
28.6
0.02%
$60
CCB
CIB
CB
AWM Corp.
FINANCIAL PERFORMANCE
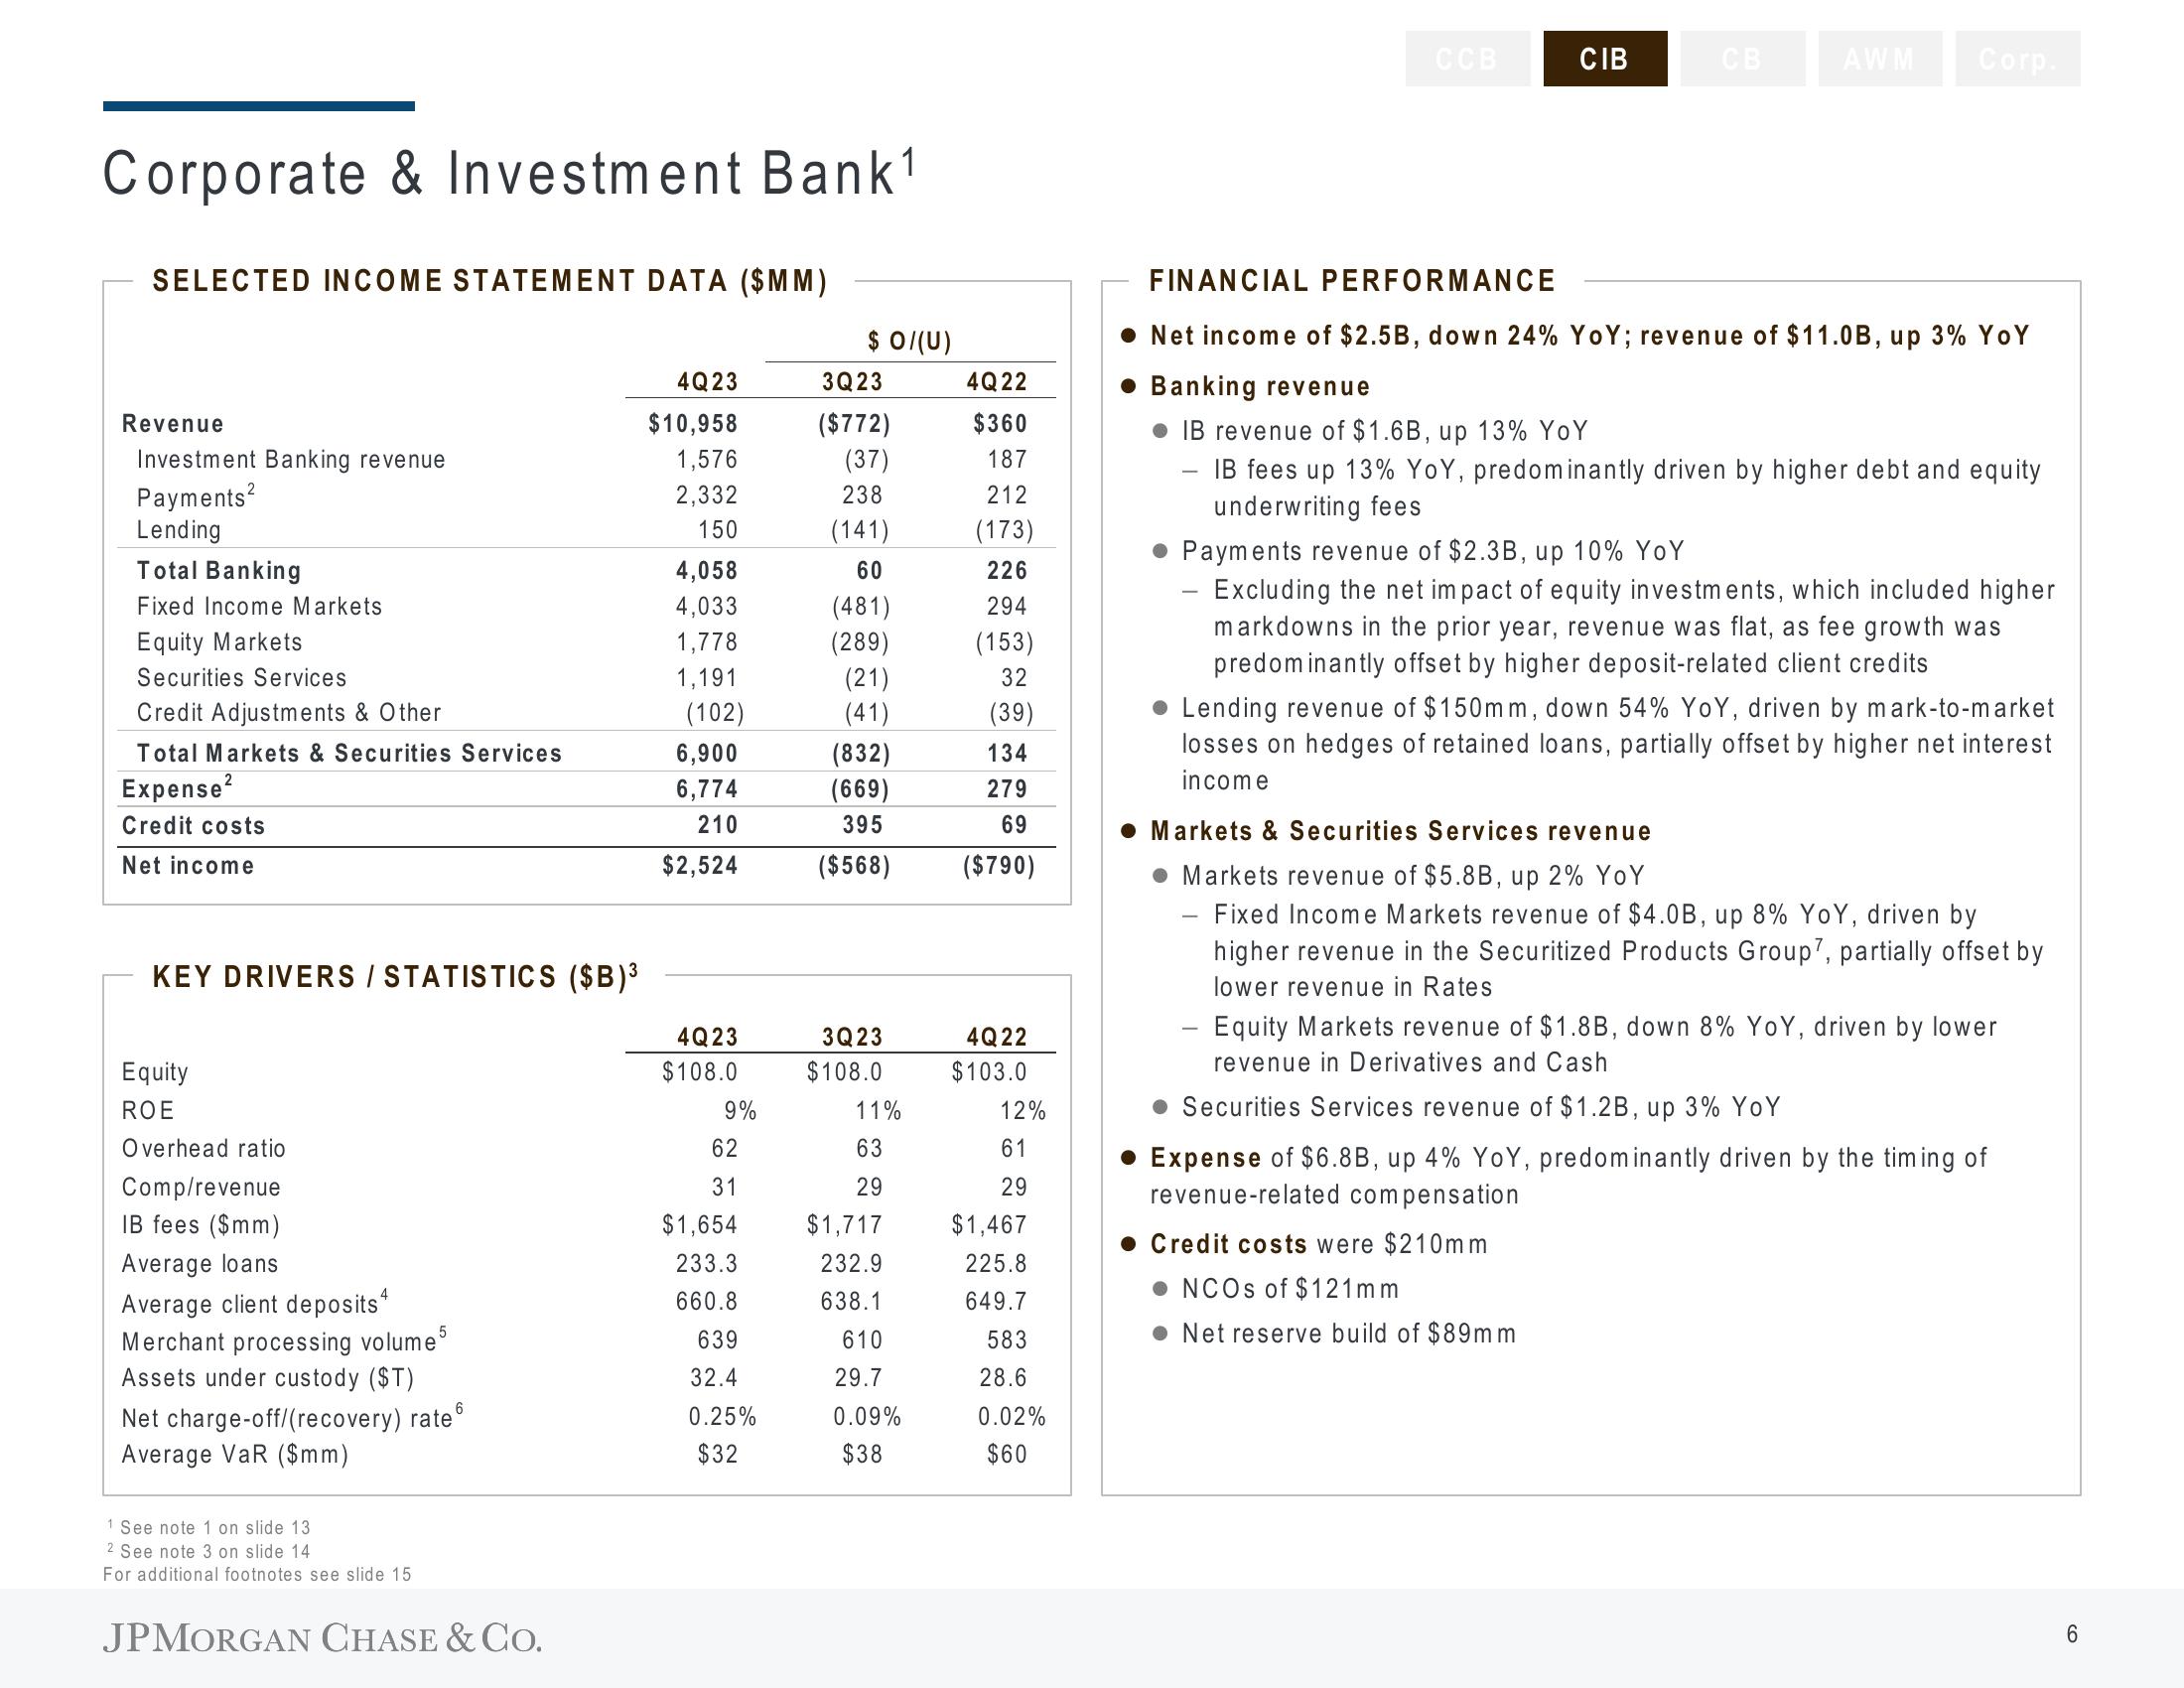
Net income of $2.5B, down 24% YoY; revenue of $11.0B, up 3% YoY
Banking revenue
IB revenue of $1.6B, up 13% YoY
IB fees up 13% YoY, predominantly driven by higher debt and equity
underwriting fees
Payments revenue of $2.3B, up 10% YoY
Excluding the net impact of equity investments, which included higher
markdowns in the prior year, revenue was flat, as fee growth was
predominantly offset by higher deposit-related client credits
Lending revenue of $150mm, down 54% YoY, driven by mark-to-market
losses on hedges of retained loans, partially offset by higher net interest
income
Markets & Securities Services revenue
Markets revenue of $5.8B, up 2% YoY
Fixed Income Markets revenue of $4.0B, up 8% YOY, driven by
higher revenue in the Securitized Products Group7, partially offset by
lower revenue in Rates
- Equity Markets revenue of $1.8B, down 8% YoY, driven by lower
revenue in Derivatives and Cash
Securities Services revenue of $1.2B, up 3% YoY
Expense of $6.8B, up 4% YoY, predominantly driven by the timing of
revenue-related compensation
Credit costs were $210mm
NCOs of $121mm
Net reserve build of $89mm
6View entire presentation