Sterling Results Presentation Deck
31
Appendix -Non-GAAP to GAAP Reconciliation
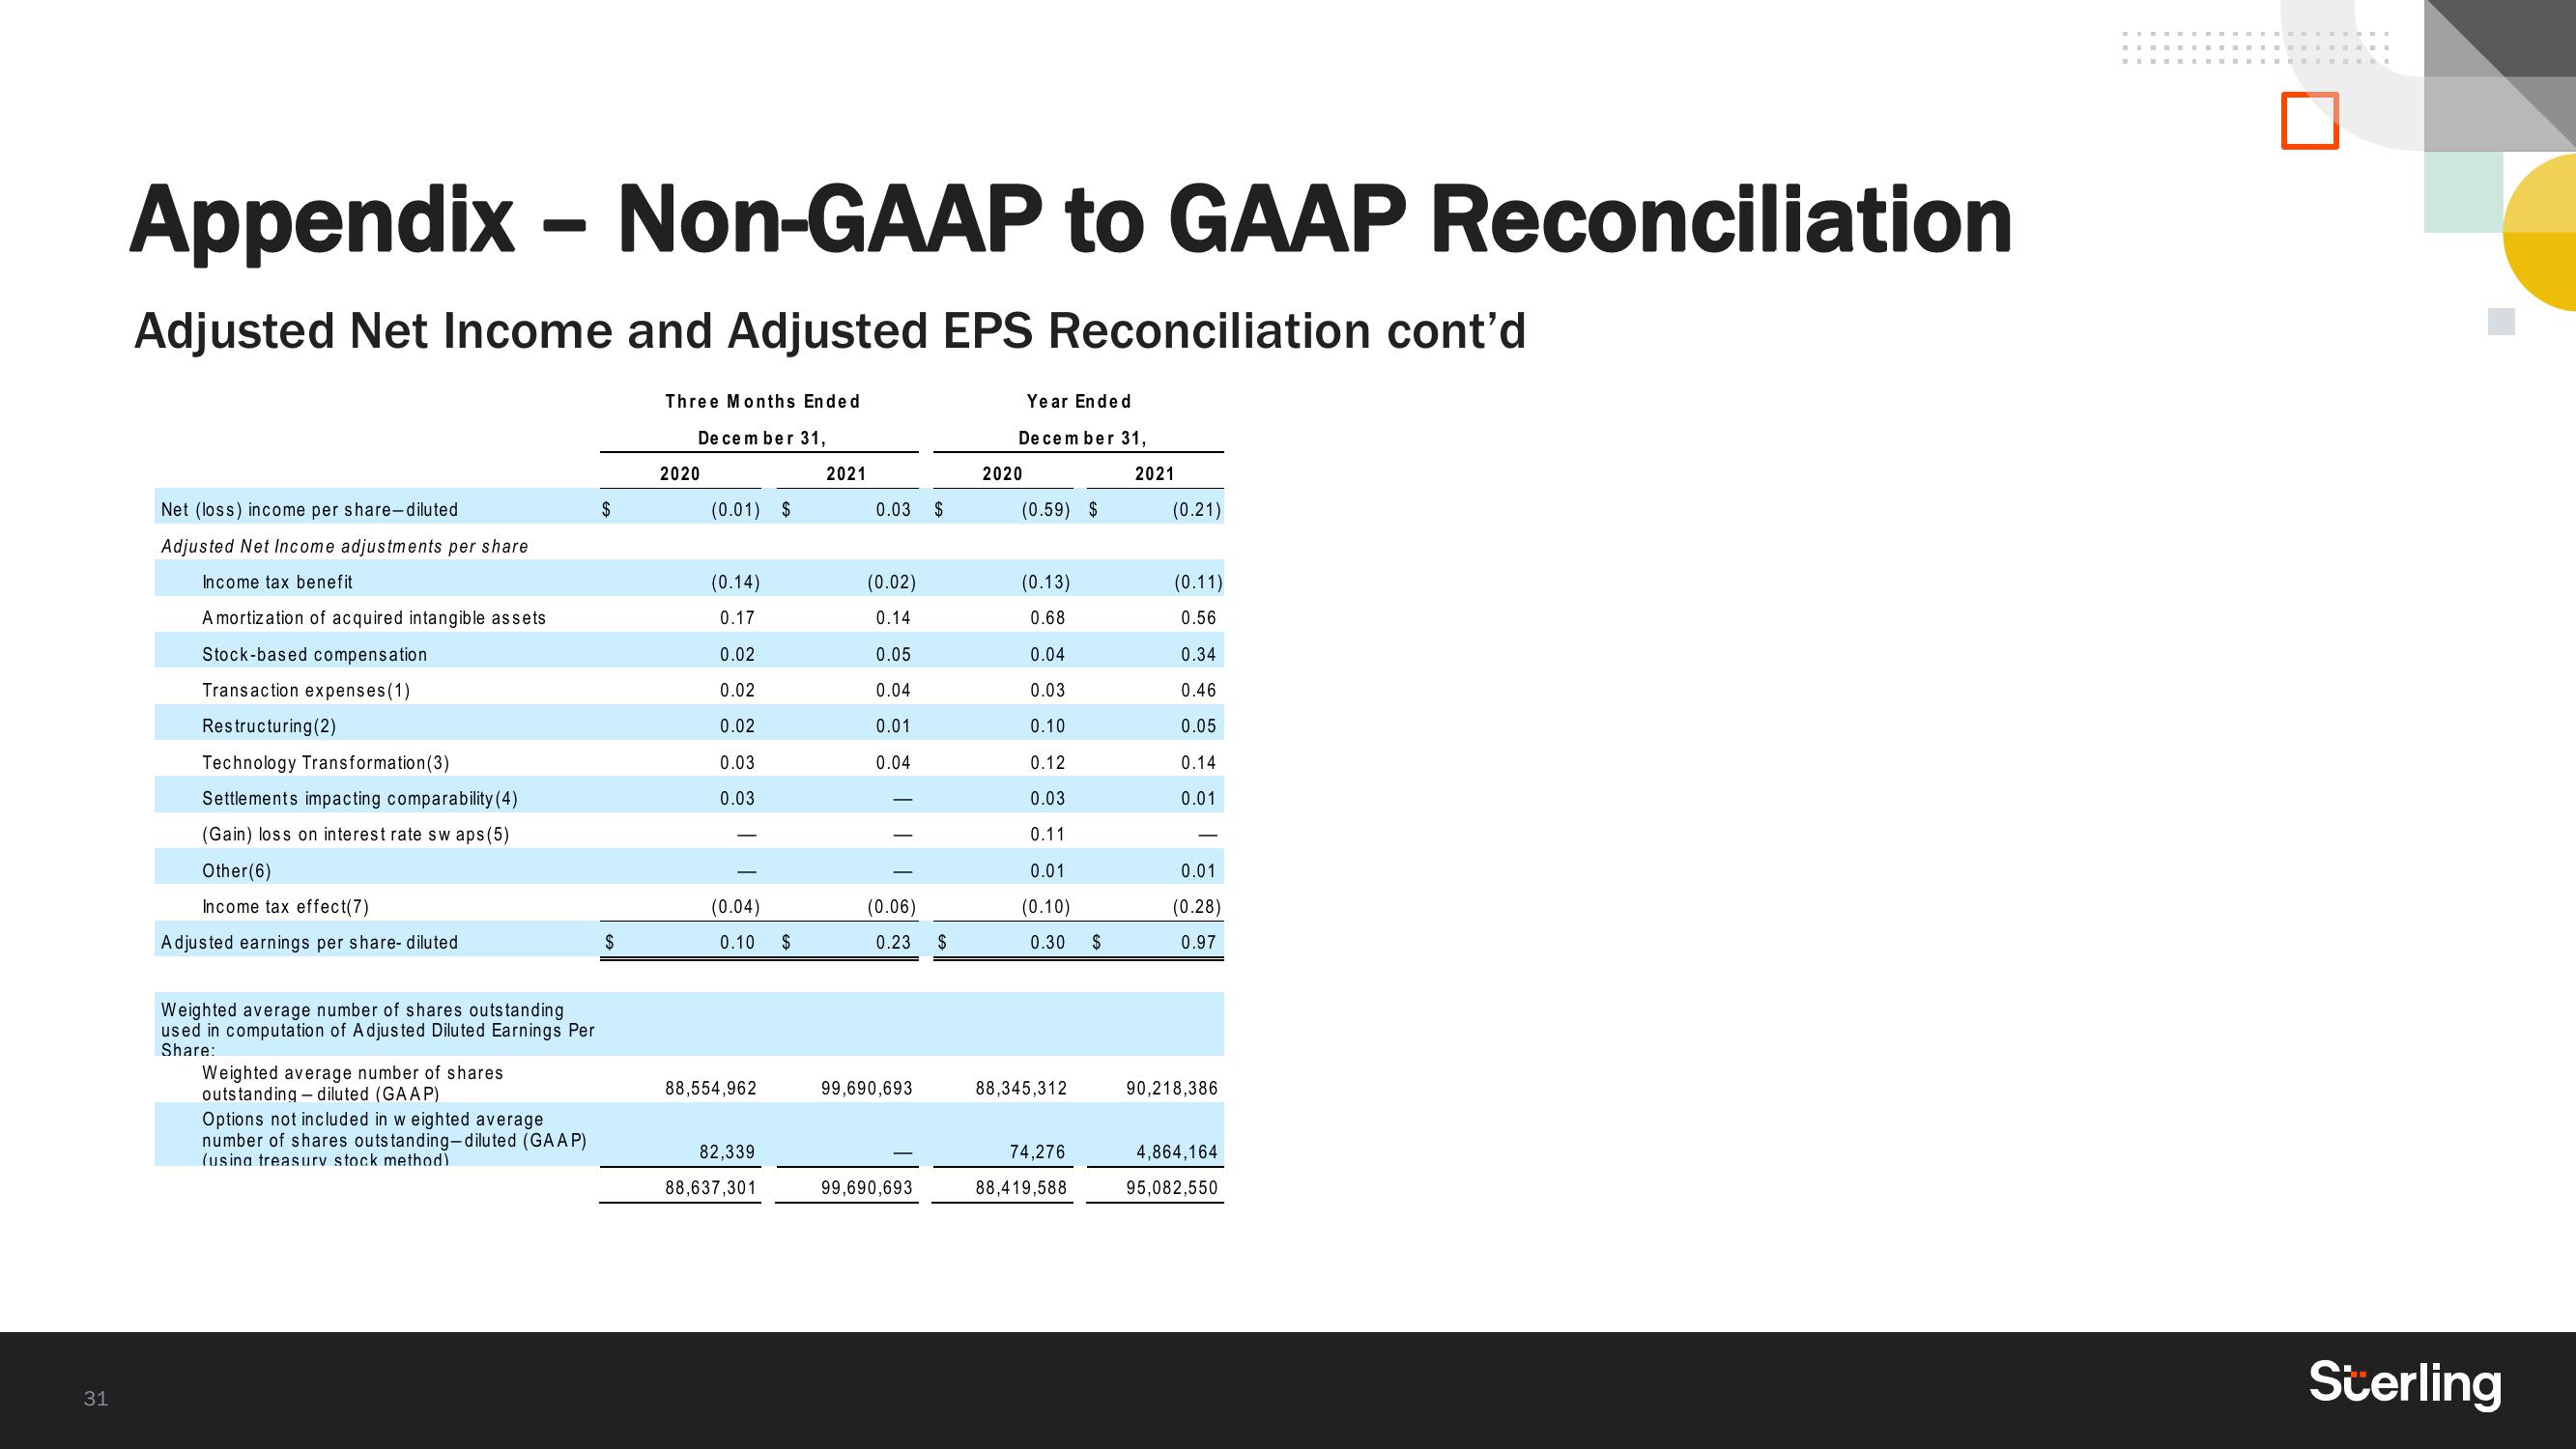
Adjusted Net Income and Adjusted EPS Reconciliation cont'd
Net (loss) income per share-diluted
Adjusted Net Income adjustments per share
Income tax benefit
Amortization of acquired intangible assets
Stock-based compensation
Transaction expenses (1)
Restructuring (2)
Technology Transformation (3)
Settlements impacting comparability (4)
(Gain) loss on interest rate sw aps (5)
Other (6)
Income tax effect(7)
Adjusted earnings per share- diluted
Weighted average number of shares outstanding
used in computation of Adjusted Diluted Earnings Per
Share:
Weighted average number of shares
outstanding diluted (GAAP)
Options not included in weighted average
number of shares outstanding-diluted (GAAP)
(using treasury stock method)
$
$
Three Months Ended
December 31,
2020
(0.01) $
(0.14)
0.17
0.02
0.02
0.02
0.03
0.03
(0.04)
0.10 $
88,554,962
82,339
88,637,301
2021
0.03 $
(0.02)
0.14
0.05
0.04
0.01
0.04
(0.06)
0.23 $
99,690,693
99,690,693
Year Ended
December 31,
2020
(0.59) $
(0.13)
0.68
0.04
0.03
0.10
0.12
0.03
0.11
0.01
(0.10)
0.30 $
88,345,312
74,276
88,419,588
2021
(0.21)
(0.11)
0.56
0.34
0.46
0.05
0.14
0.01
0.01
(0.28)
0.97
90,218,386
4,864,164
95,082,550
SterlingView entire presentation